Consulting & Reimplementation Available: This model was originally implemented in PLASIMO during my PhD. We can discuss how to implement it in another plasma simulation software upon request, or adapt your own model, add new chemistry, or create verification workflows to test it. Contact me to discuss.
Disclaimer: PLASIMO and COMSOL Multiphysics® are not affiliated with Deep Why and require the client to hold their own licenses.
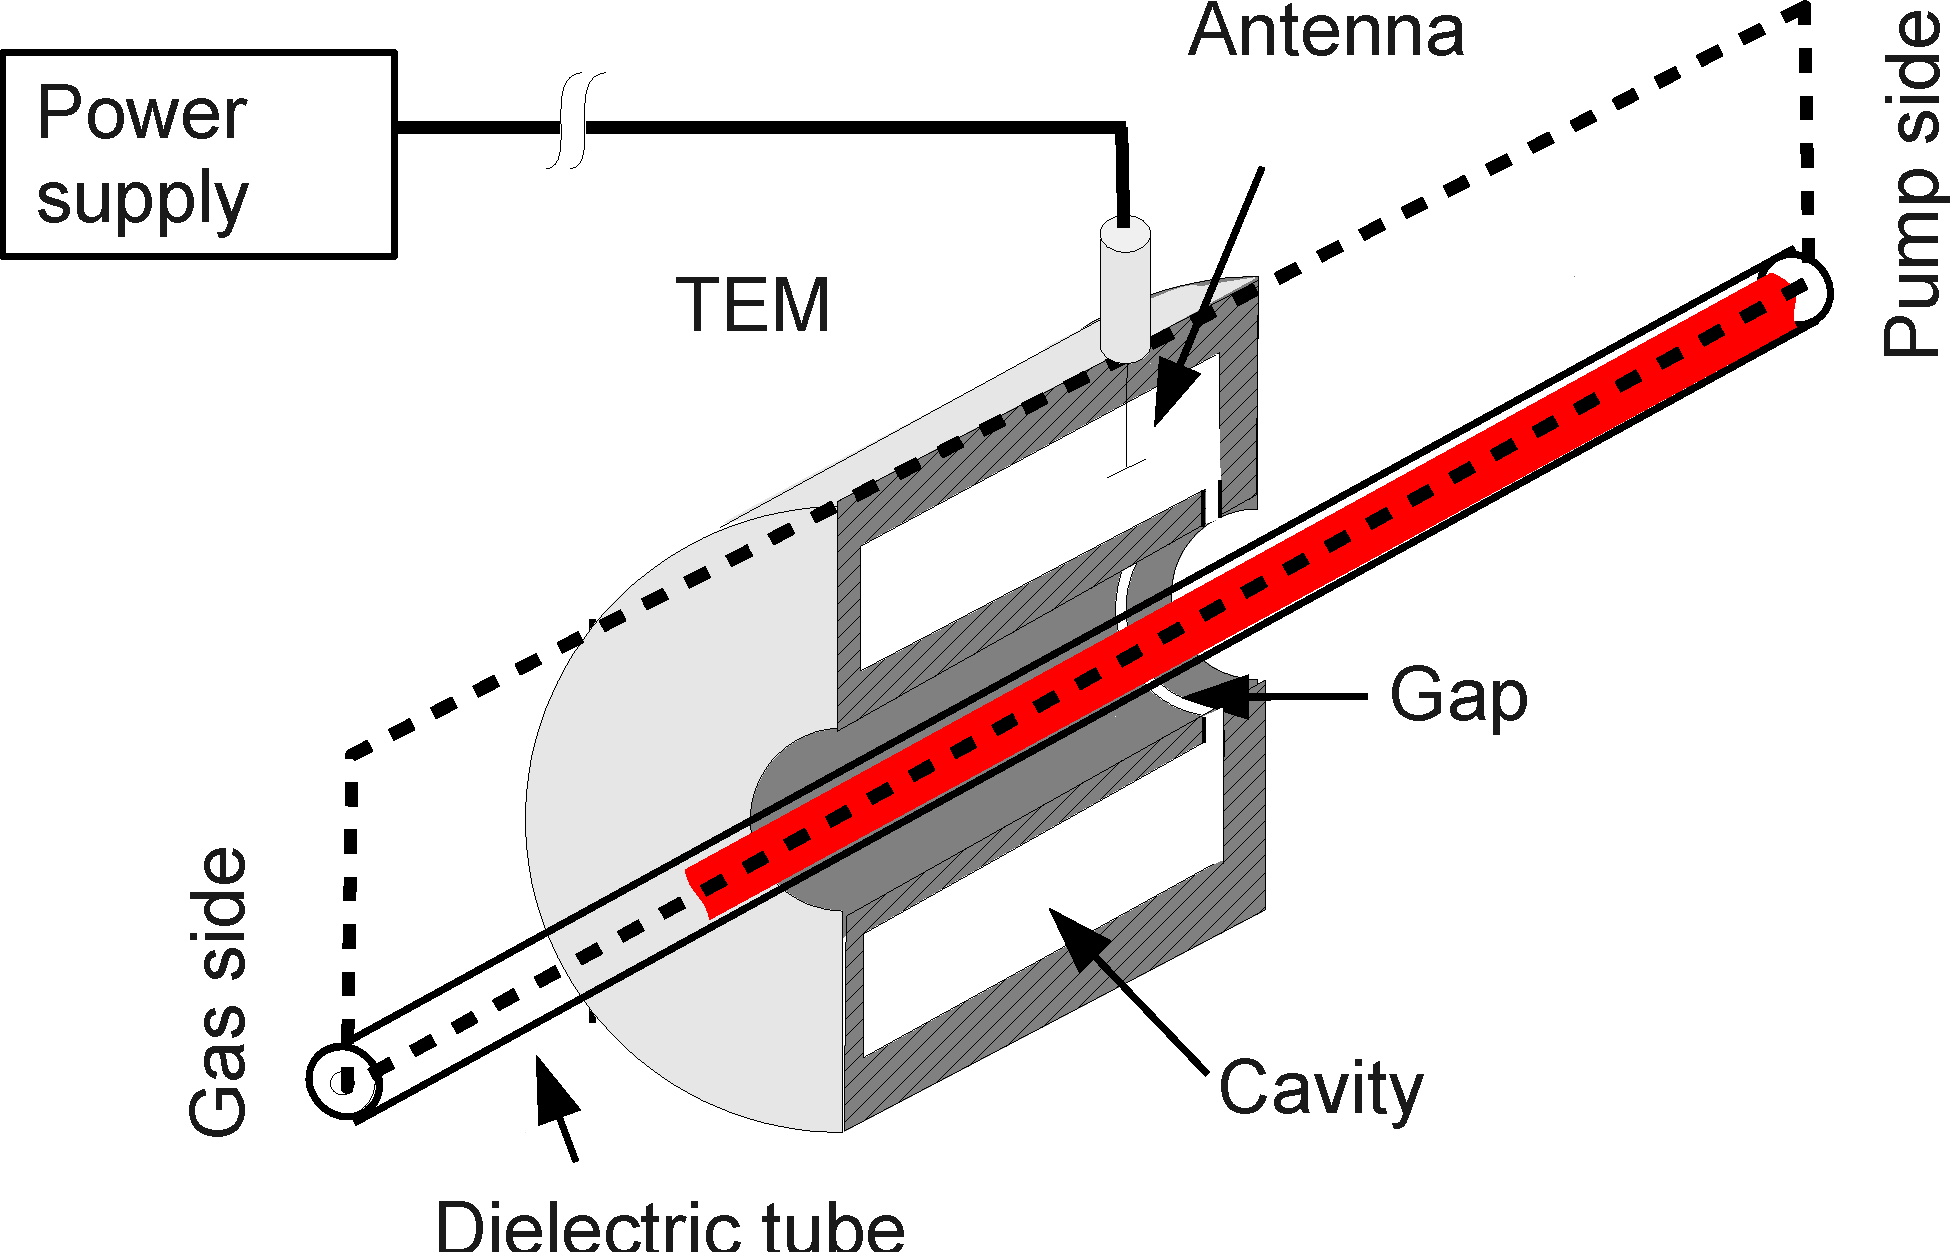
The surfatron launcher is an electromagnetic structure designed to produce surface wave discharges (SWDs). Unlike other launchers like the surfaguide, which is coupled via a rectangular waveguide for high power (kW range), the surfatron is coupled to the microwave power supply via a coaxial cable. This design choice limits the operational power to about 400 W at 2.45 GHz but yields high flexibility, making it extremely suitable for active diagnostics such as Thomson scattering (TS) measurements.
Computational Domain
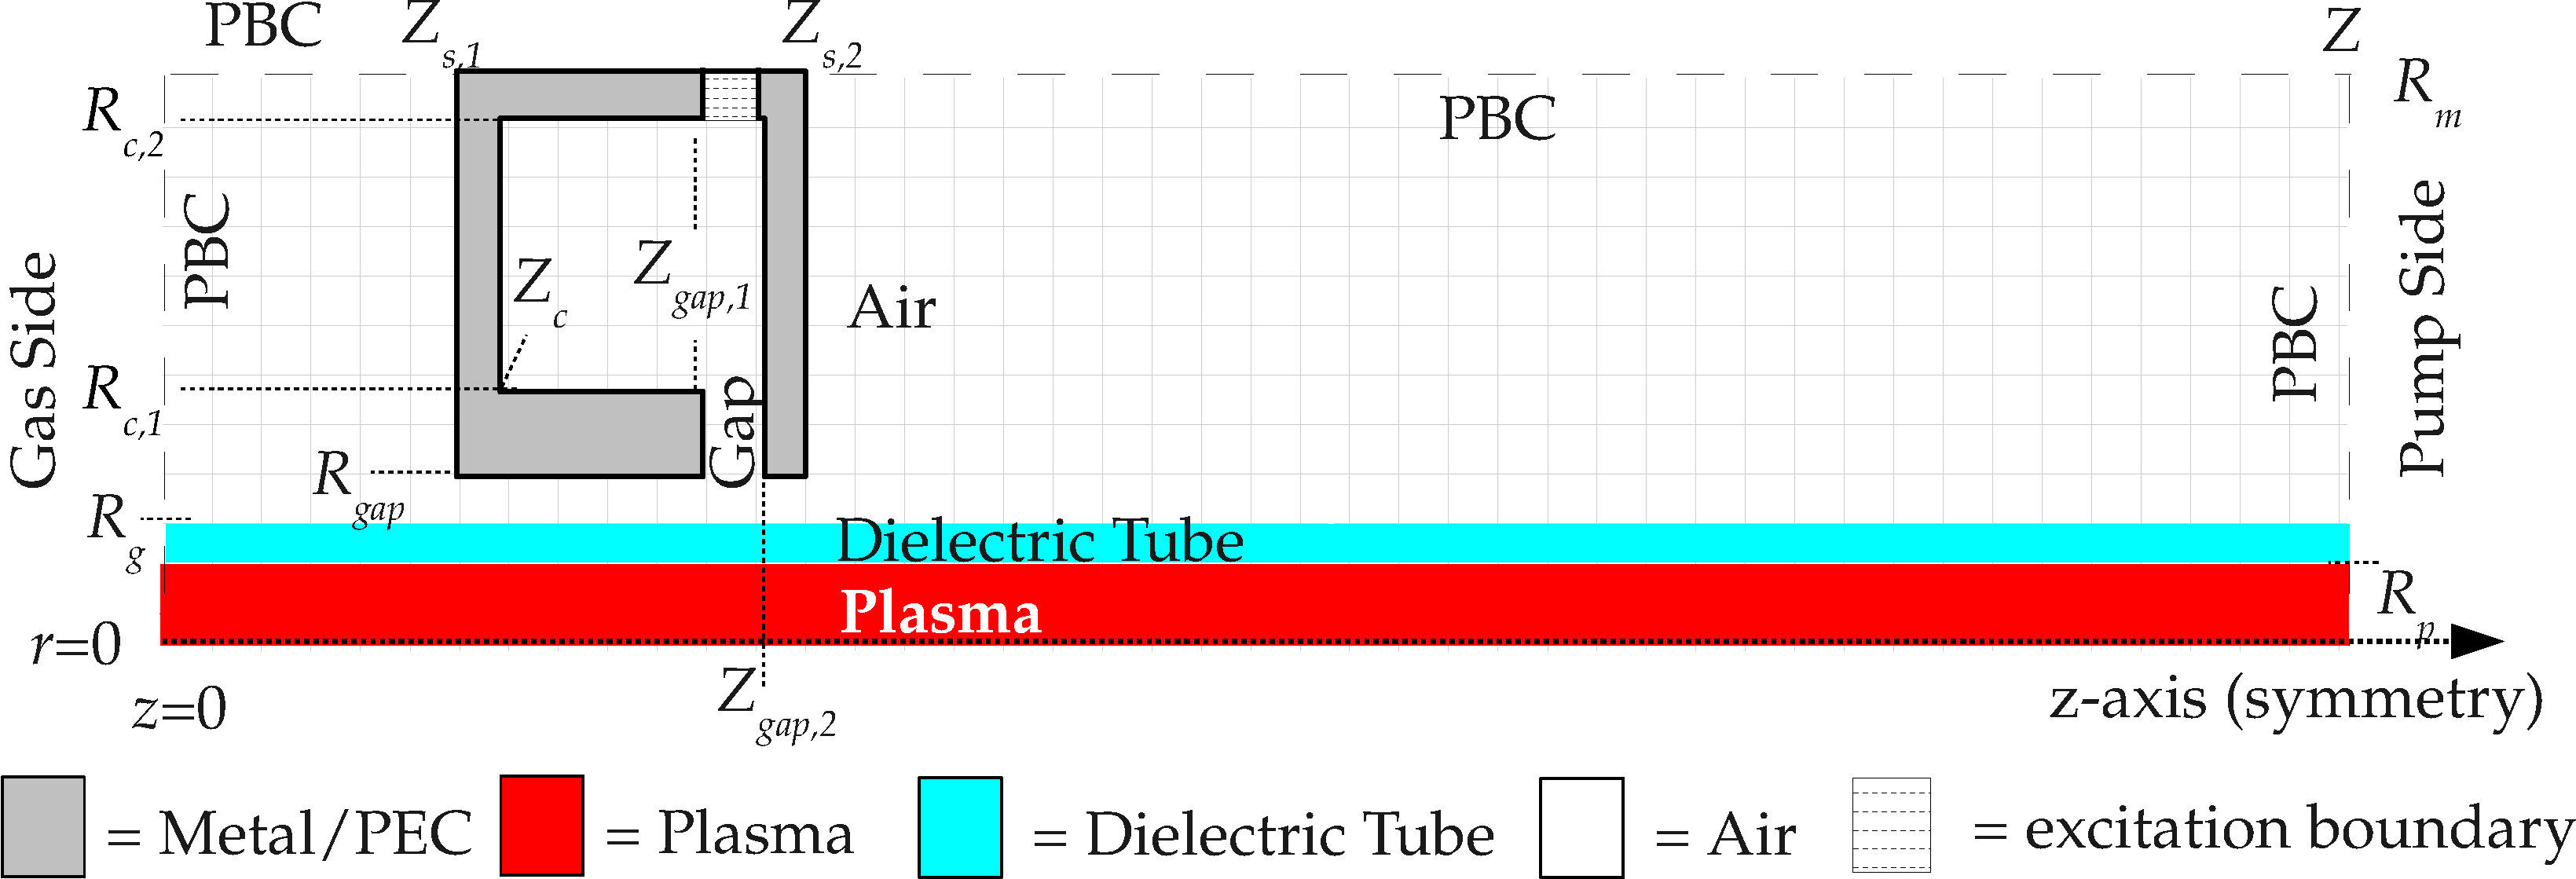
The electromagnetic and transport equations are solved in a two-dimensional axisymmetric cylindrical coordinate system. The computational domain layout defines boundary conditions such as Perfect Electrical Conductor (PEC) and Propagation Boundary Condition (PBC) to model the excitation gap and waveguide propagation.
2D Plasma Distributions (Inside and Outside the Launcher)
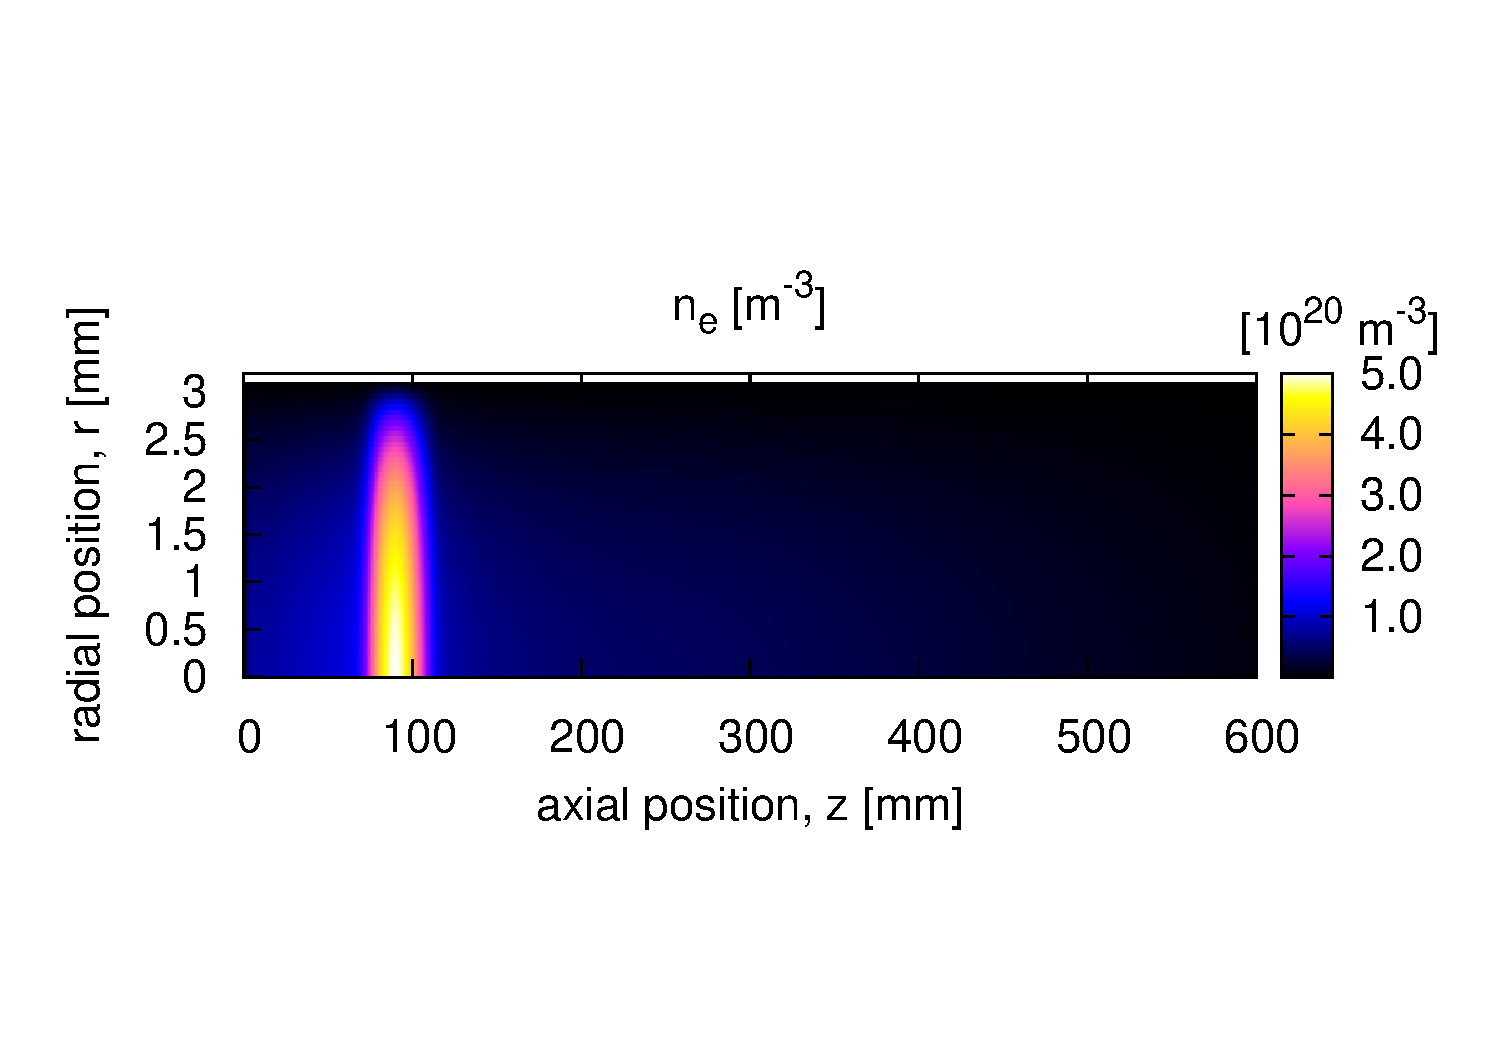
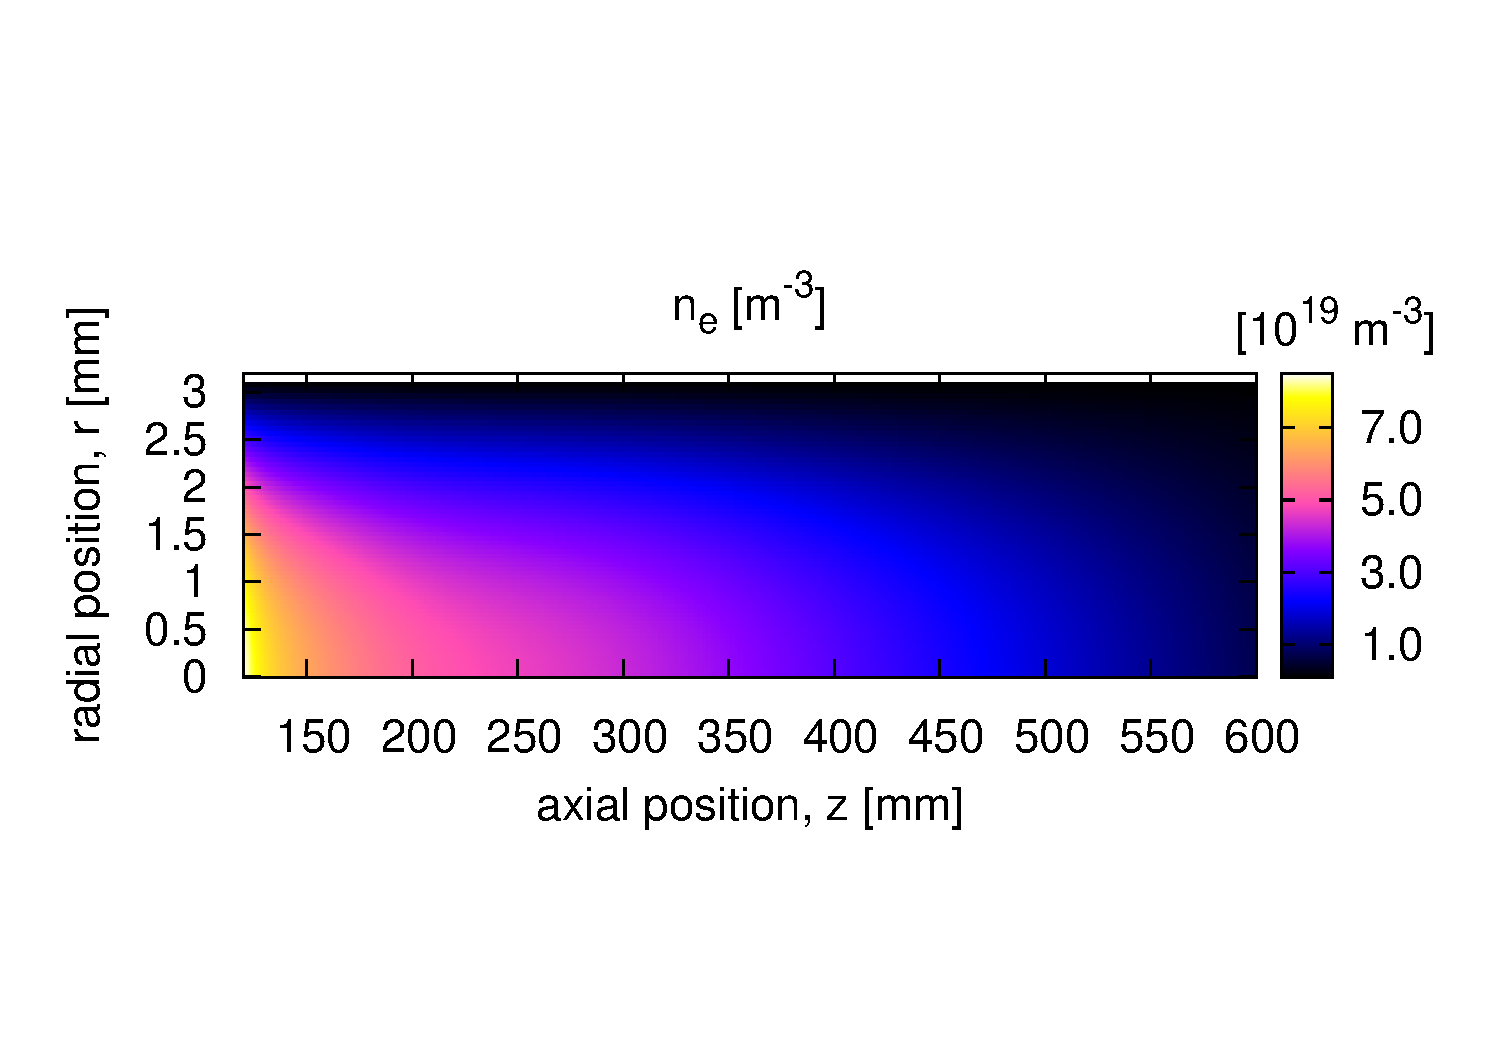
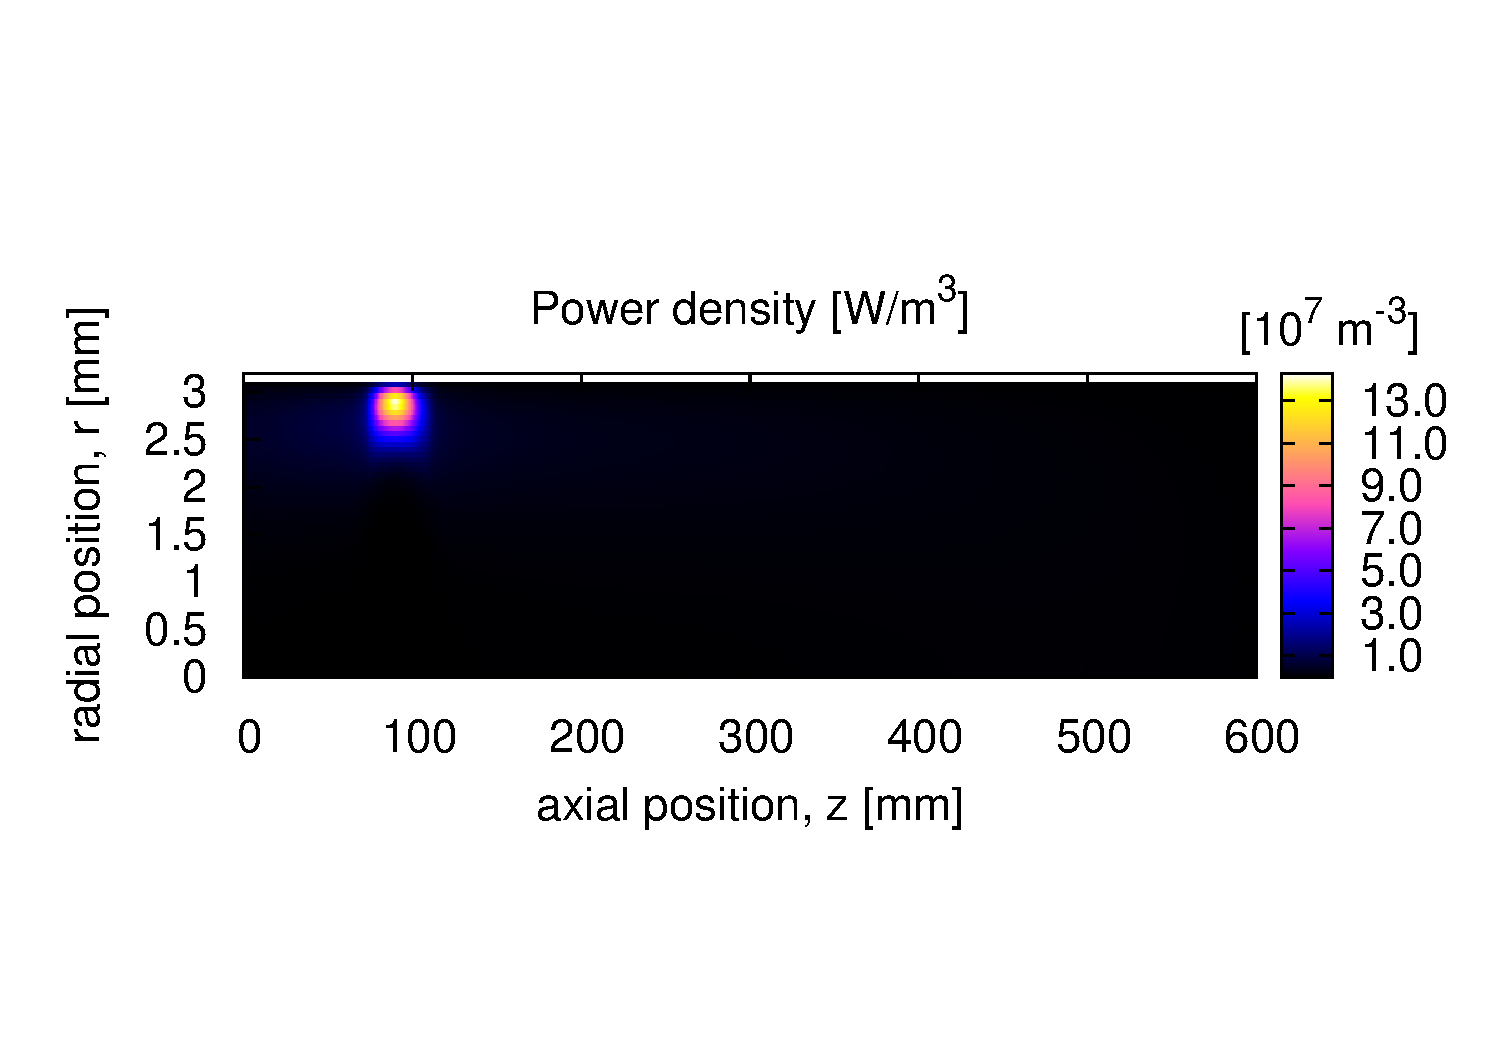
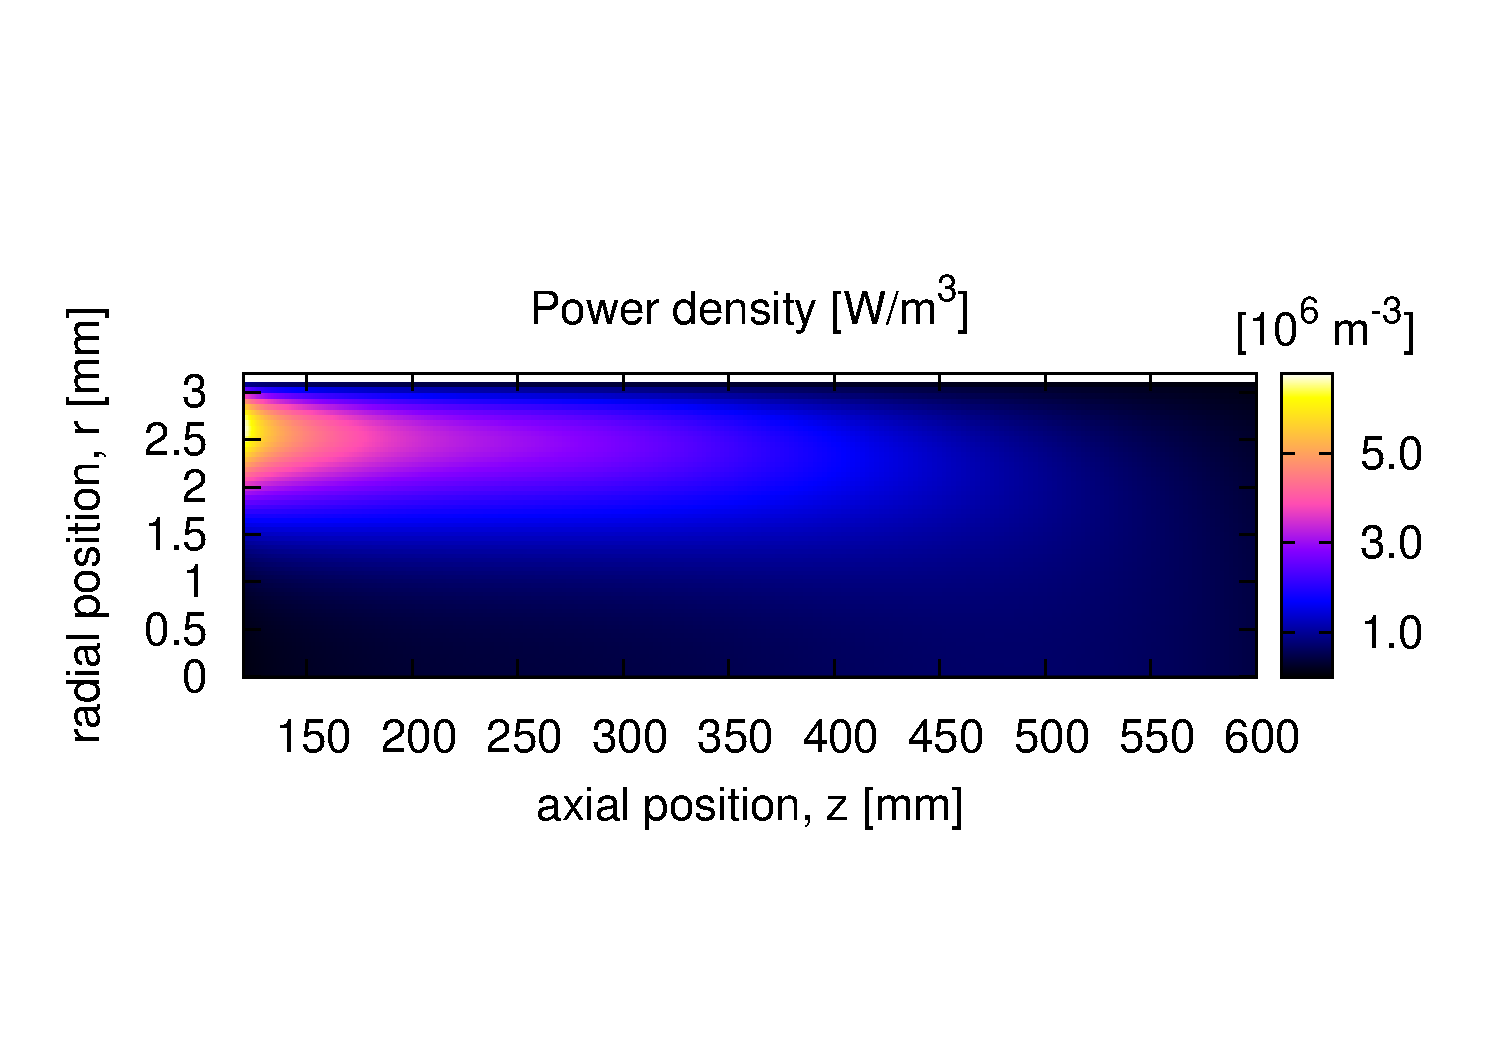
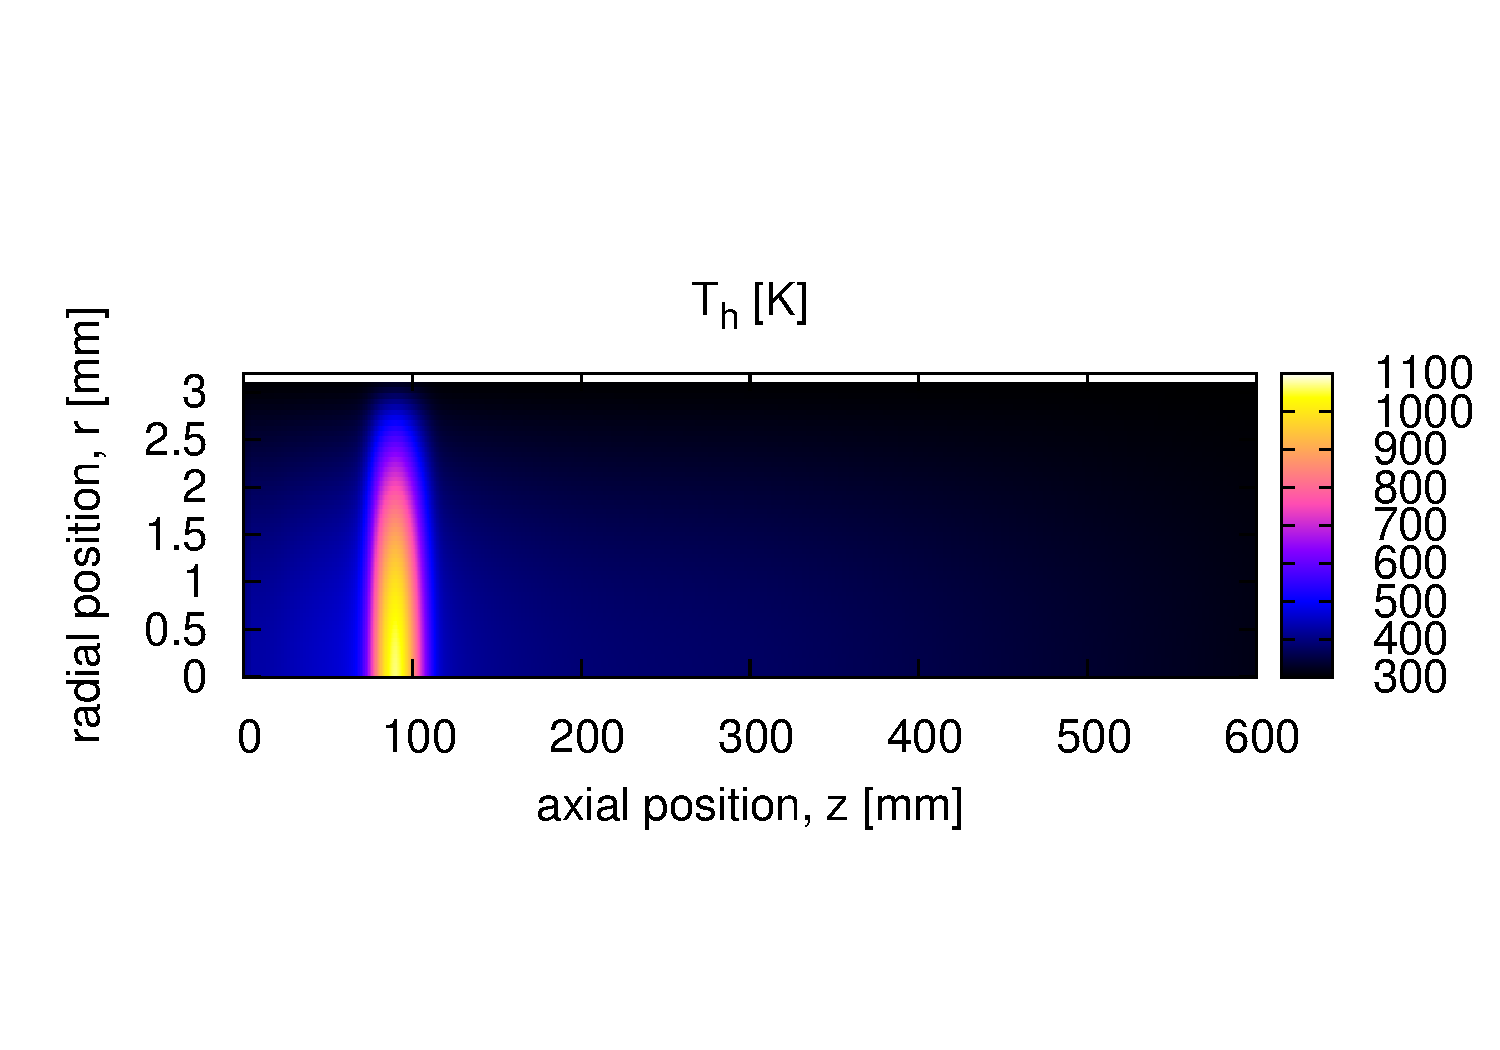
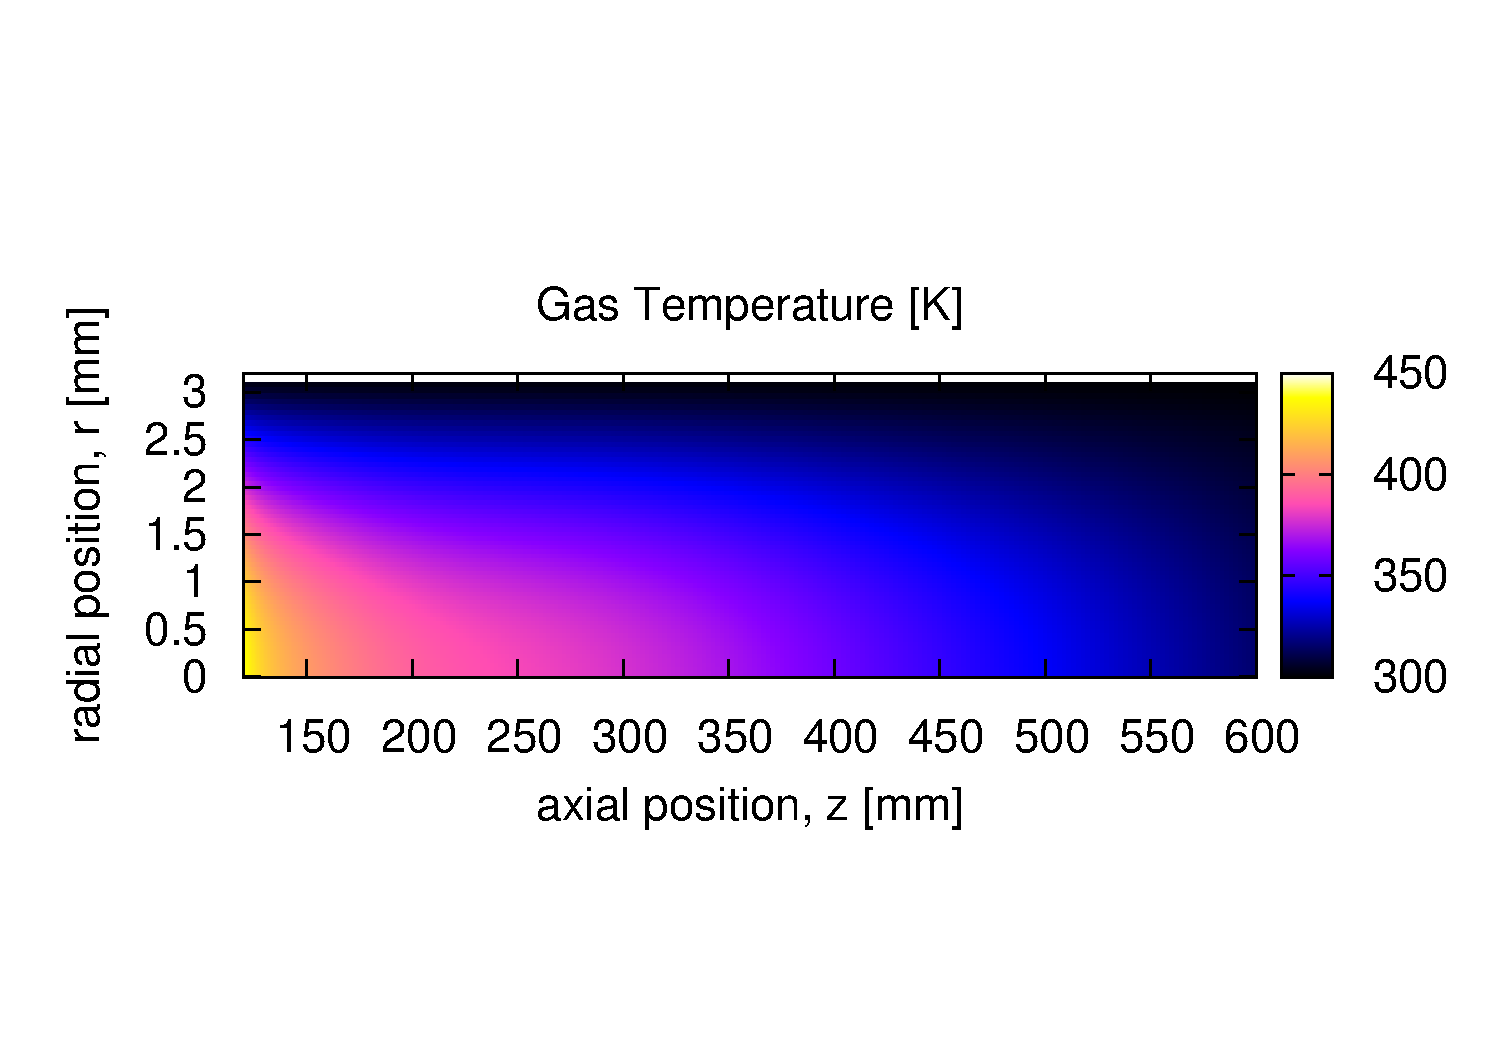
The two-dimensional contours below illustrate the distributions of electron density (a), electromagnetic power density (b), and gas temperature (c). The left column (Figure 7) displays the full discharge axis (z = 0 to 600 mm), highlighting the maximum values inside the launcher region (z = 72 - 111 mm). The right column (Figure 8) is a zoom focusing on the plasma column outside the launcher (z = 120 to 600 mm).
Model Validation Against Experiments
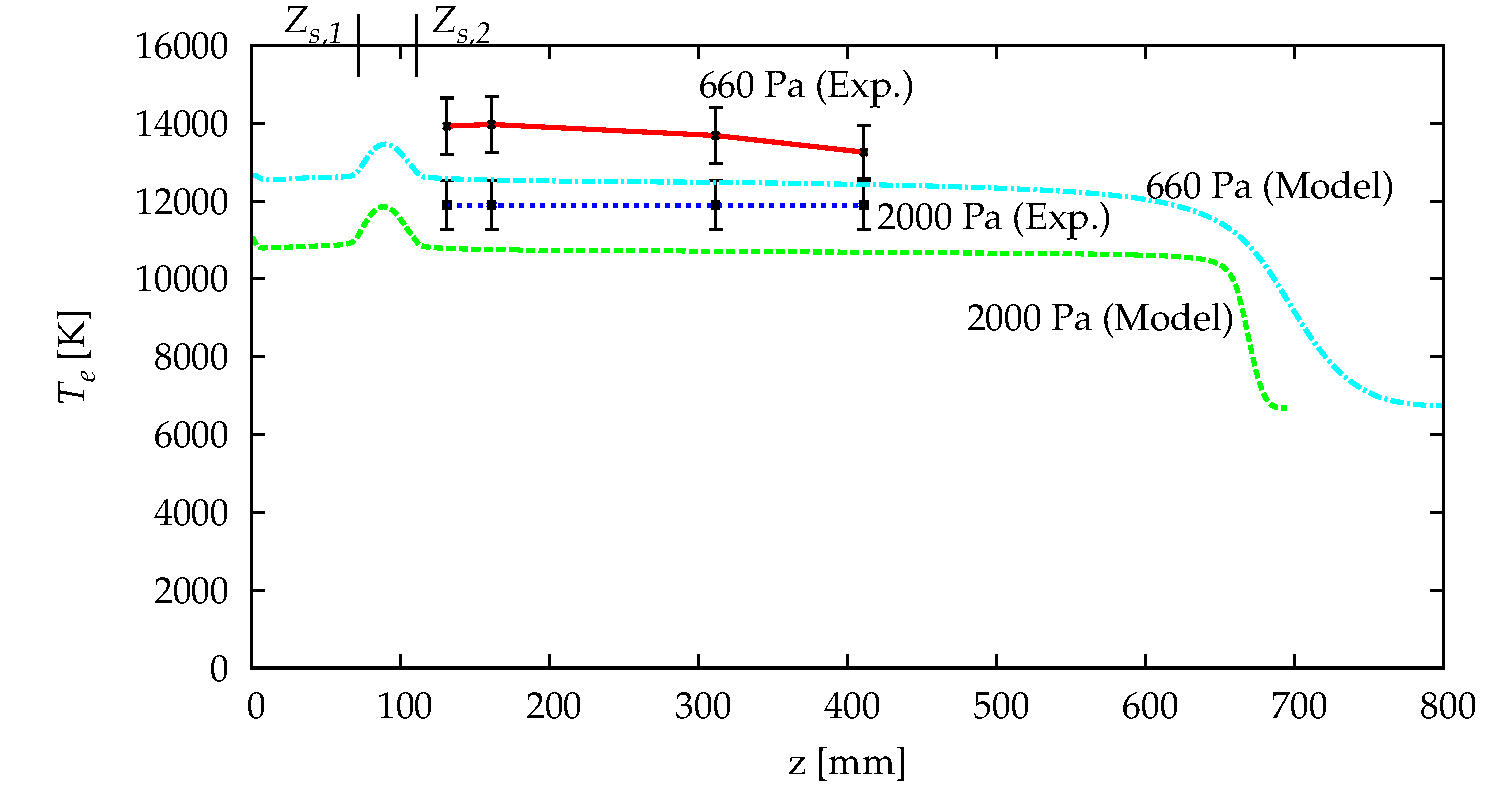
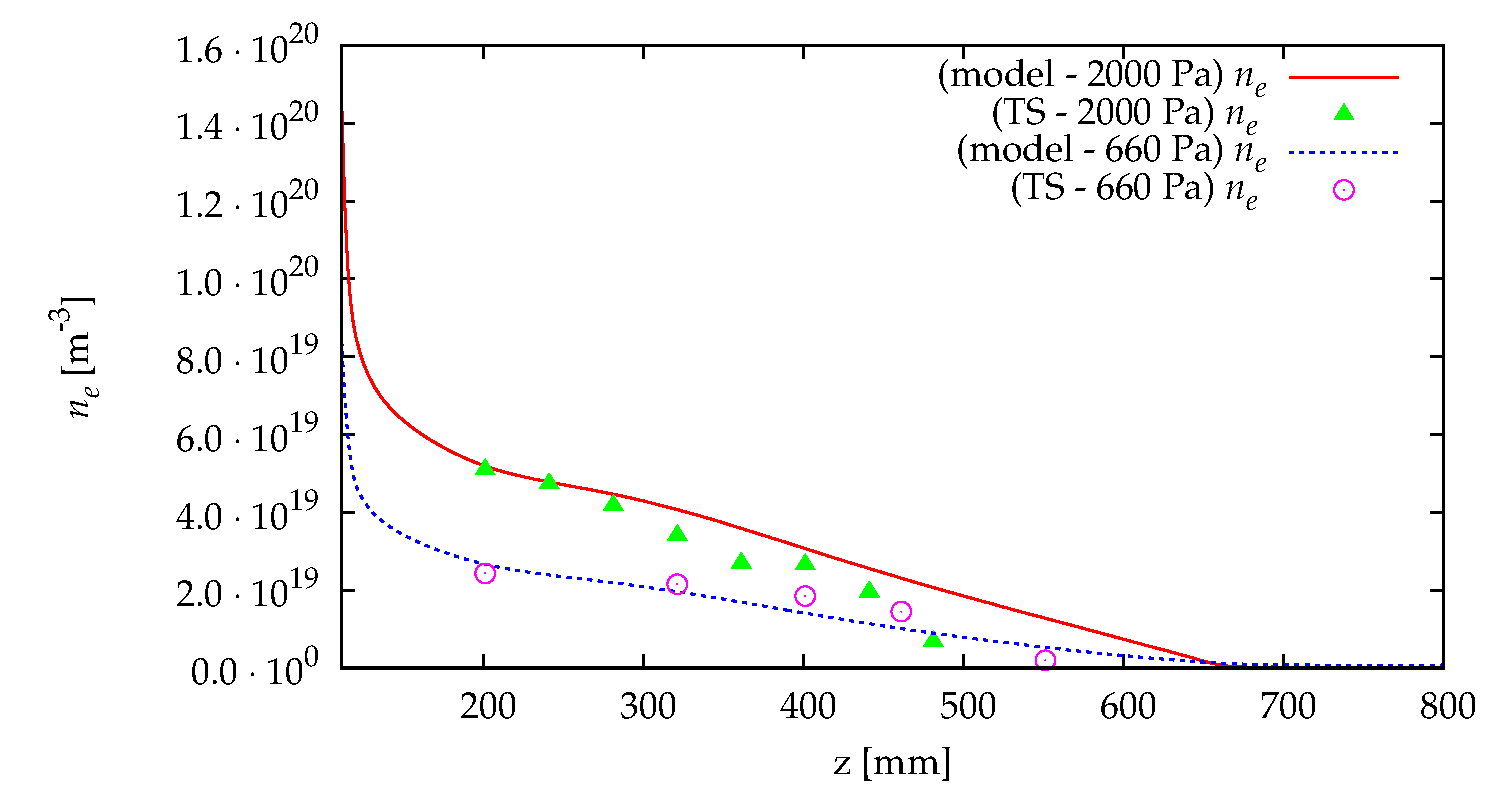
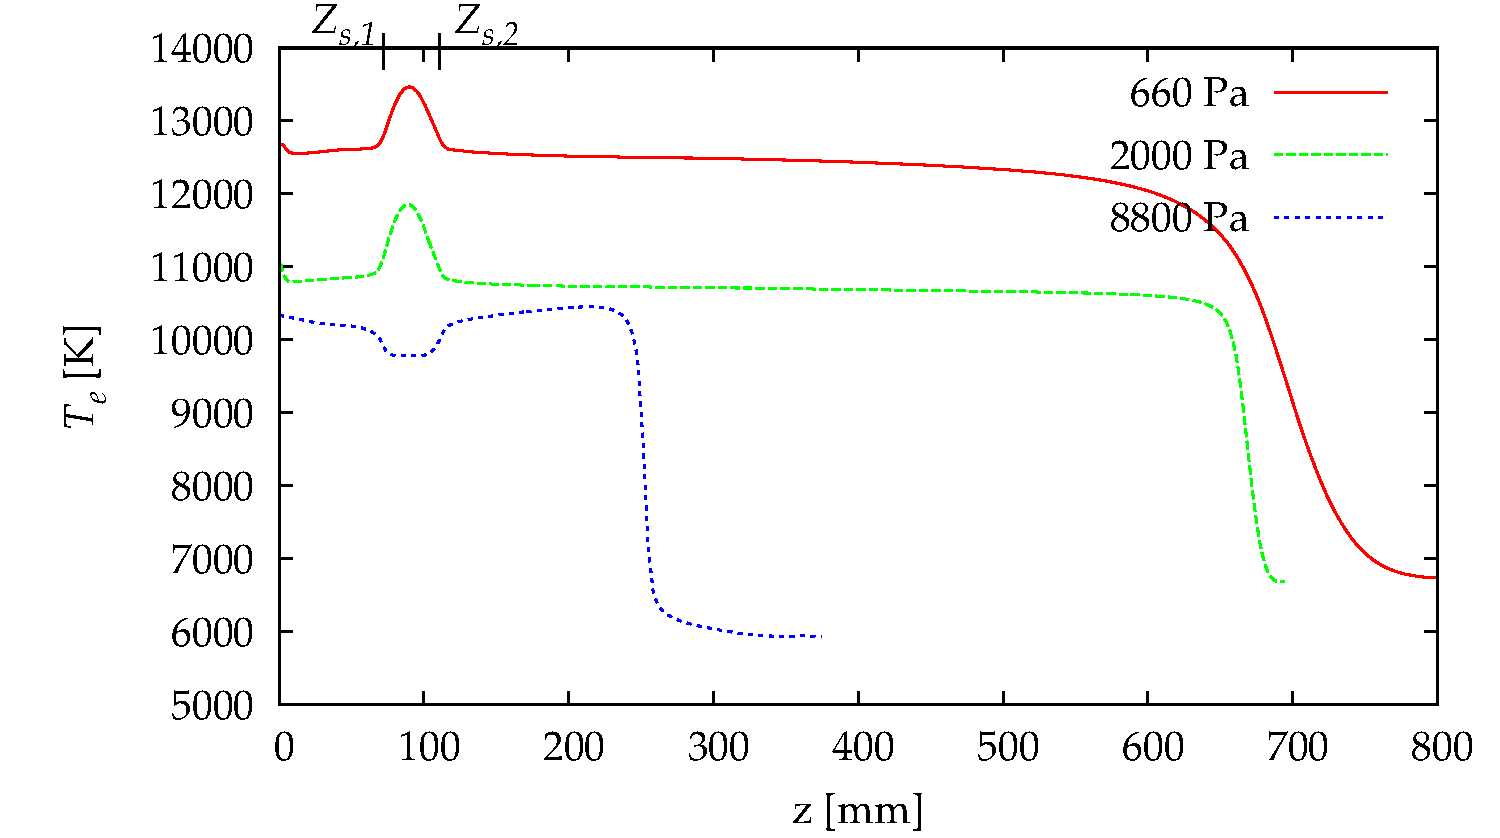
To investigate the effect of increasing pressure on the structure and shape of the plasma, we developed a 2D self-consistent (EM and quasineutral plasma, not consistent with EEDF solver) physical model. The model couples electromagnetic wave propagation, transport of charged and neutral species, and detailed argon chemistry. Crucially, the simulation results were compared with experimental Thomson scattering data across different pressures. The simulations allow us to observe how the plasma behaves when surrounded by the Faraday enclosure that represents the surfatron itself ("inside" the surfatron).
Interconnection: Molecular Ions and Gas Temperature
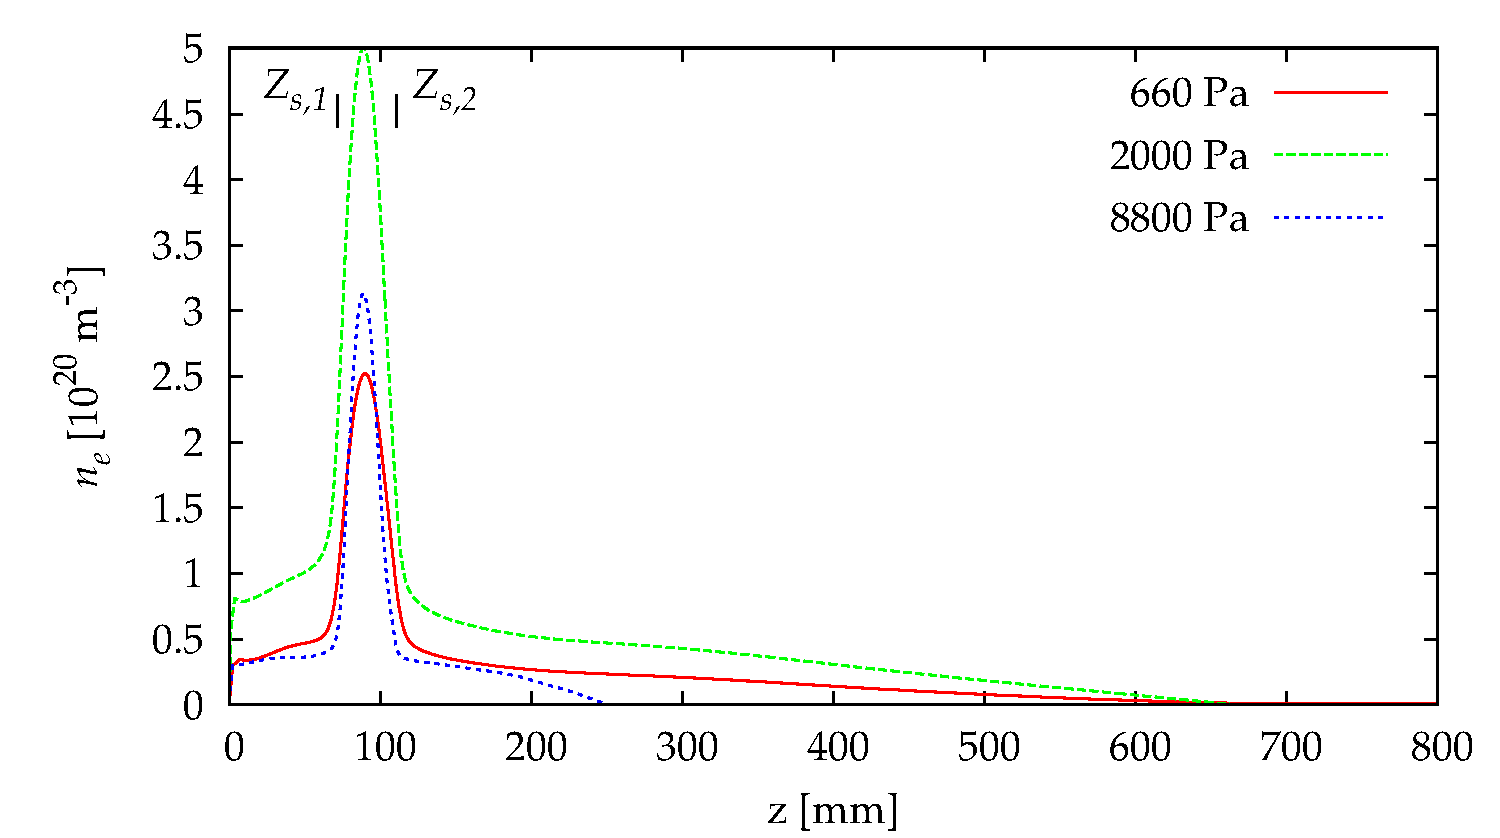
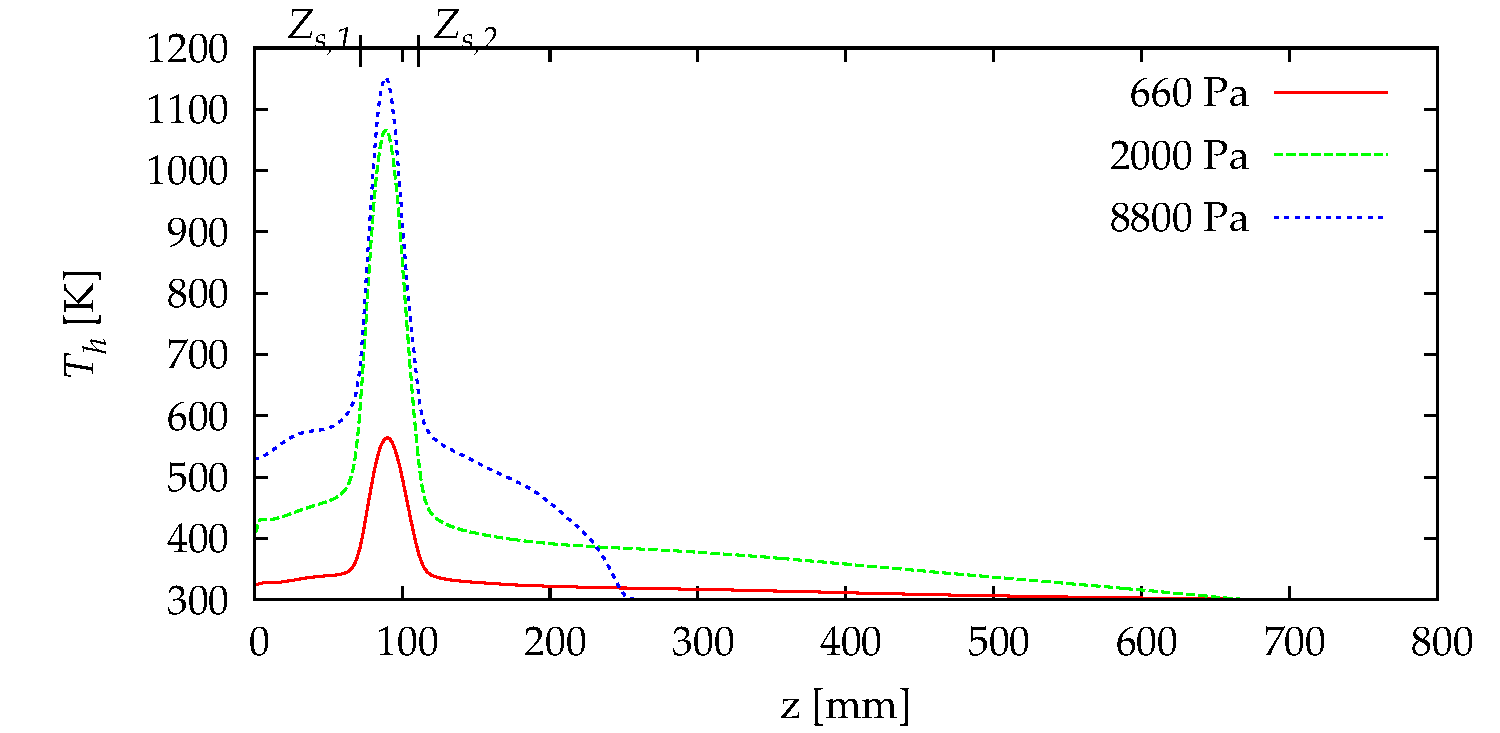
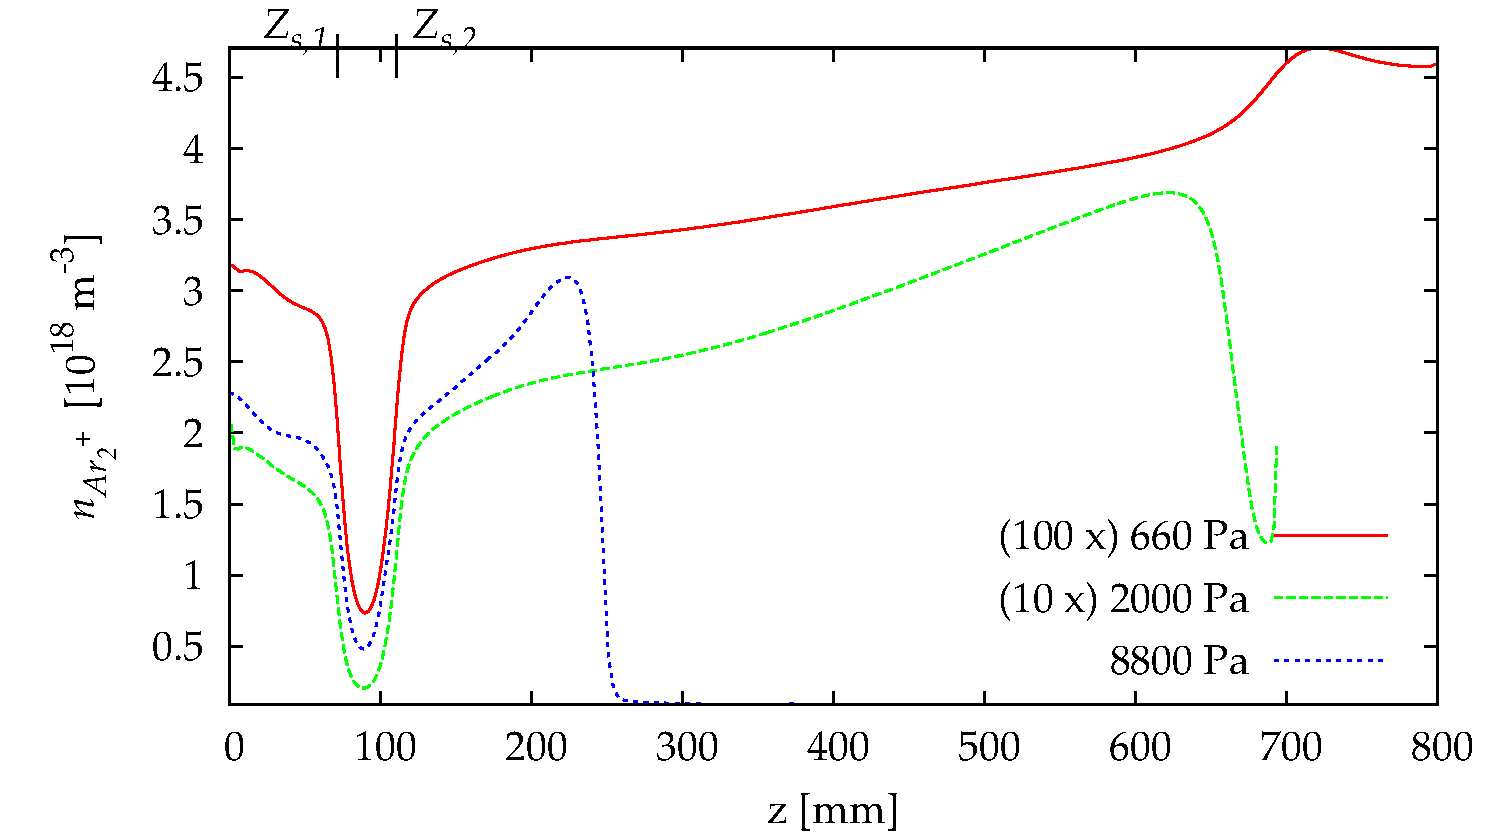
As the operational pressure increases towards the intermediate range (2000–8800 Pa), volume recombination processes become increasingly dominant, comparable in magnitude to ambipolar diffusion. The formation of molecular ions (such as Ar2+) plays a vital role in facilitating these volume recombination events.
The density of these molecular species and the resulting recombination rates are strongly coupled with the spatial distribution of the gas temperature. As the gas temperature rises, it alters both the neutral density profiles and the rate constants of the molecular ion chemistry, preventing the plasma from expanding to the discharge tube walls and causing constriction.
Bibliography
- Jimenez-Diaz M., Carbone E.A.D., Dijk J. van, and Mullen J.J.A.M. van der (2012). A two-dimensional PLASIMO multiphysics model for the plasma - electromagnetic interaction in surface wave discharges: the surfatron source. Journal of Physics D: Applied Physics, 45(33), 335204. [ read article ]
- Jimenez-Diaz M. (2011). Modelling of microwave induced plasmas: the interplay between electromagnetism, plasma chemistry and transport. PhD Thesis, Eindhoven University of Technology (TU/e). [ read thesis pdf ]