Consulting & Reimplementation Available: This model was originally implemented in PLASIMO during my PhD. We can discuss how to implement it in another plasma simulation software upon request, or adapt your own model, add new chemistry, or create verification workflows to test it. Contact me to discuss.
Disclaimer: PLASIMO and COMSOL Multiphysics® are not affiliated with Deep Why and require the client to hold their own licenses.
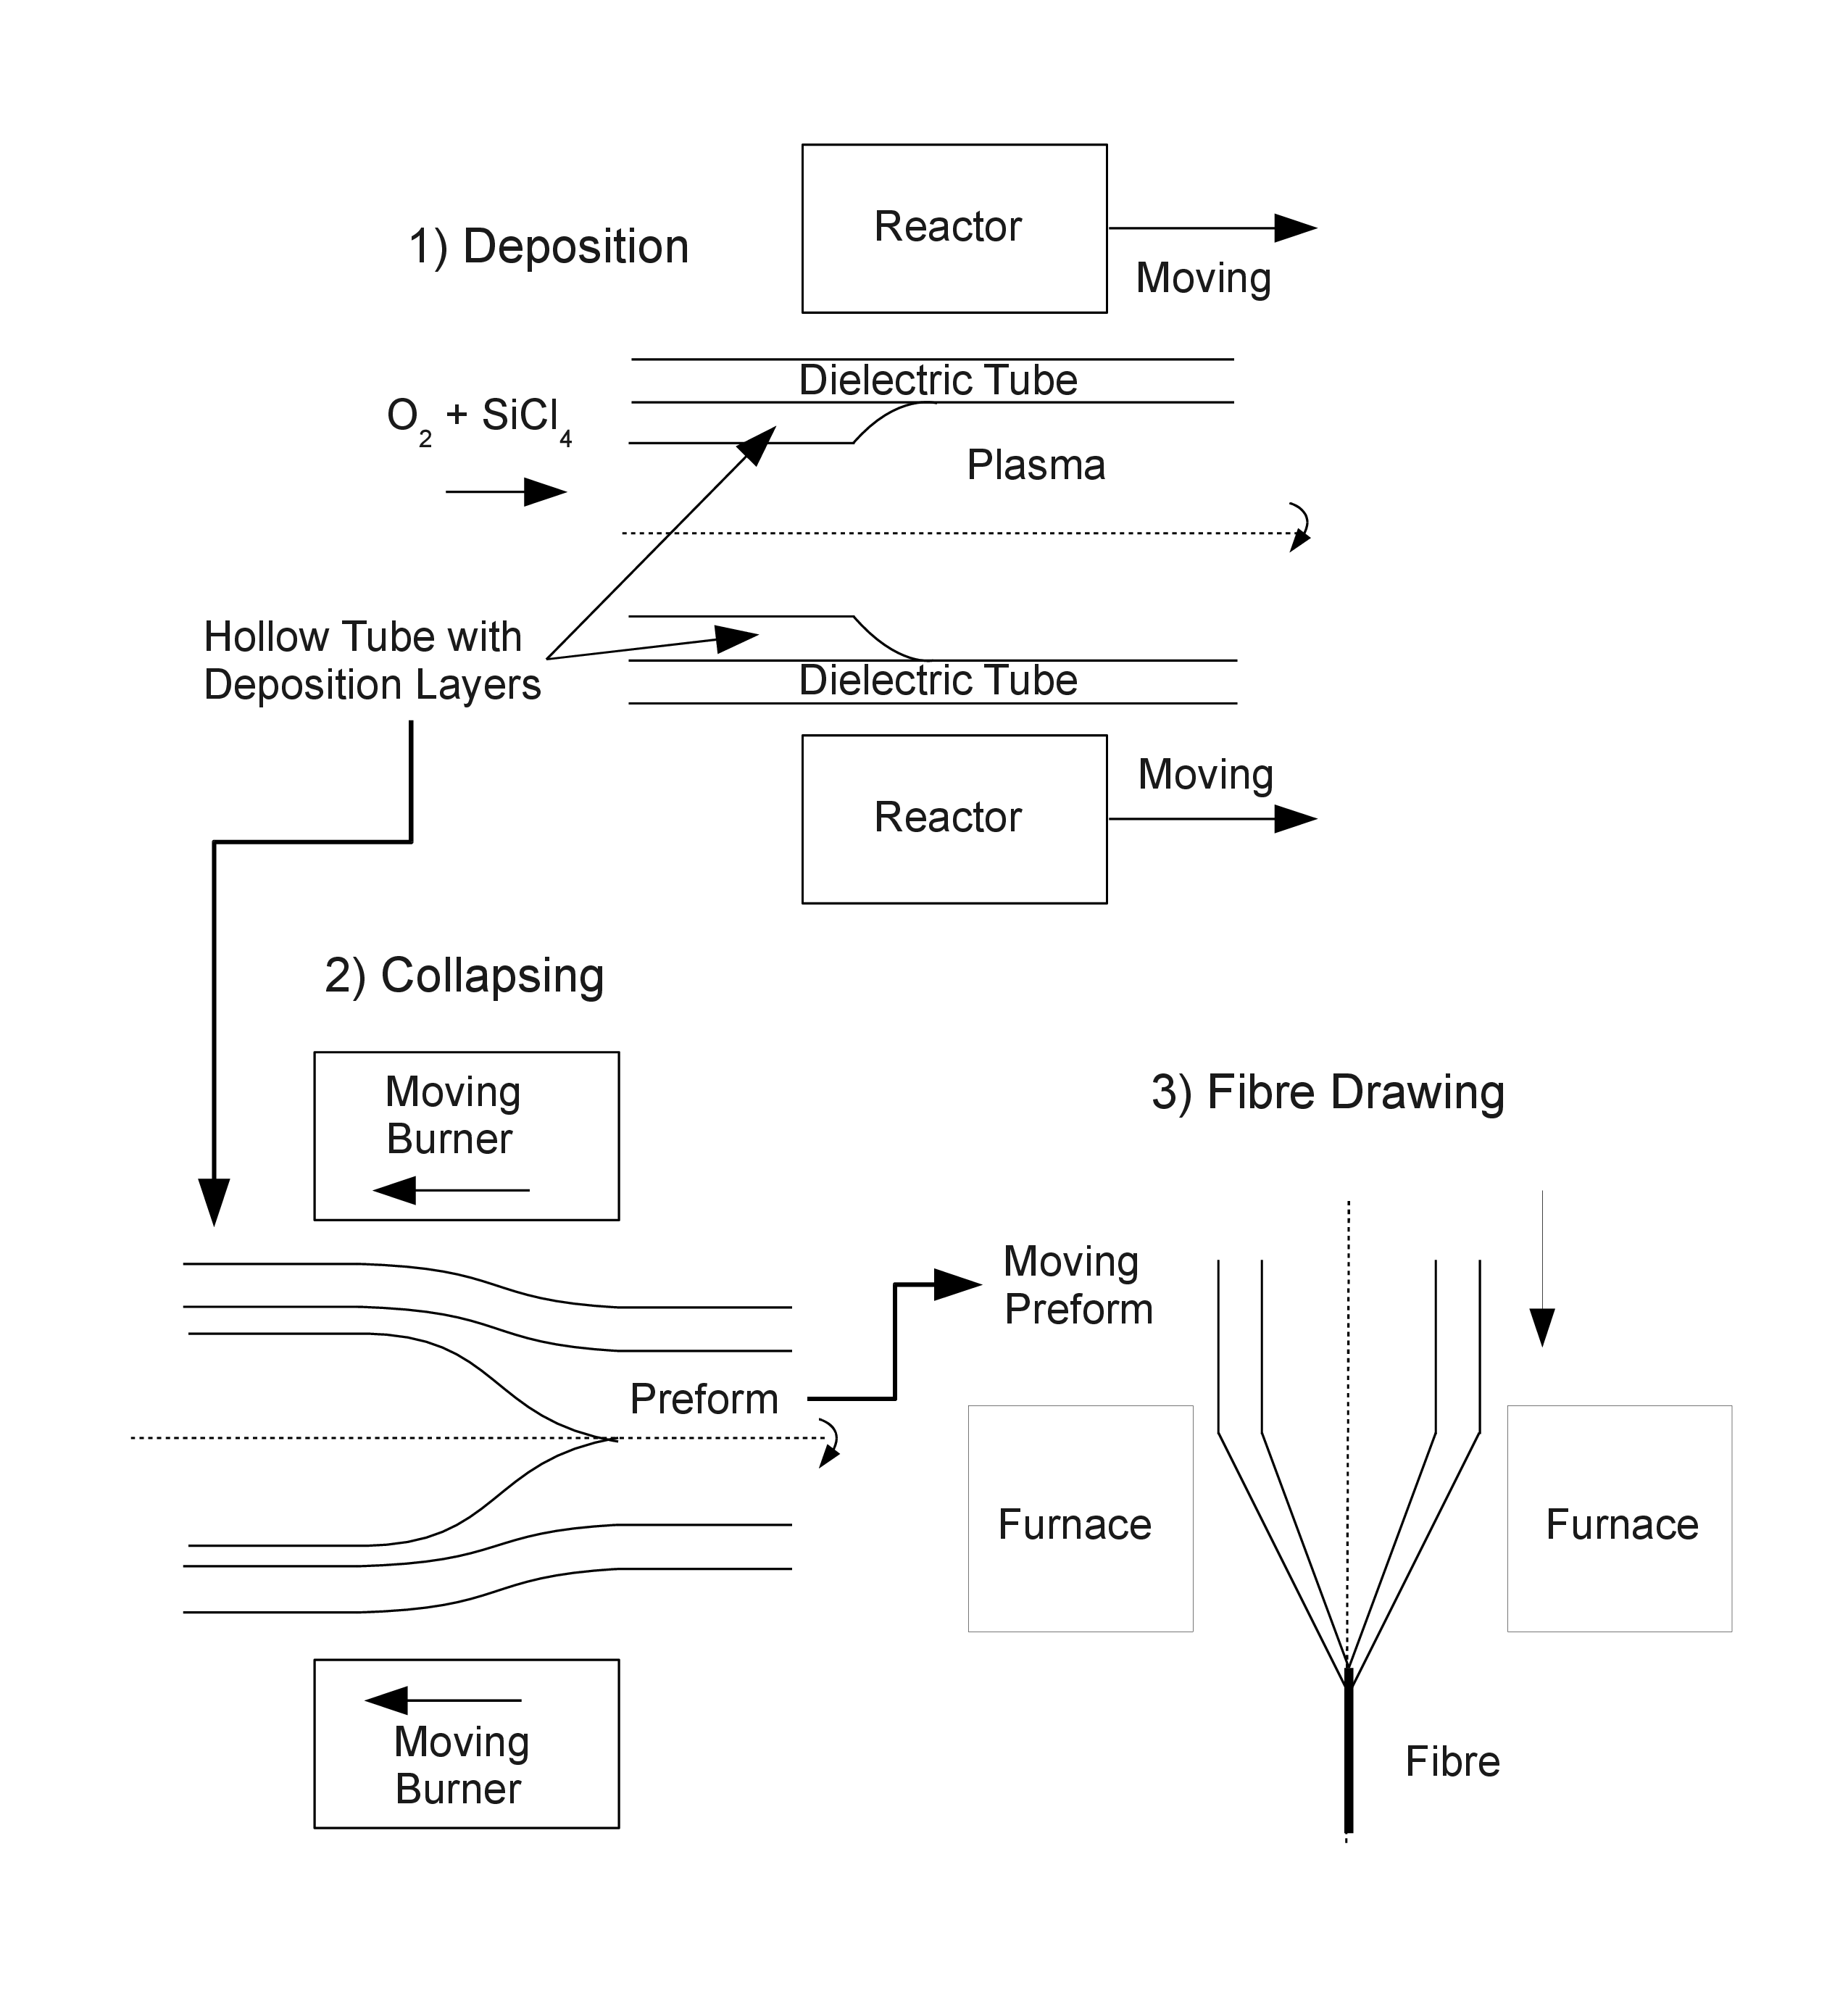
Microwave Induced Plasmas (MIPs) are widely used in industrial applications such as the Plasma-activated Chemical Vapour Deposition (PCVD) process, which is the foundational step in the fabrication of high-quality optical fibers (such as those produced at Draka).
During PCVD, a moving microwave resonator surrounds a quartz tube, creating a non-local thermal equilibrium plasma. By feeding gases like $\mathrm{SiCl_4}$ and $\mathrm{O_2}$ into the tube, thin glass layers are deposited on the inner wall, forming the core refractive index profile of the preform. To prevent electromagnetic radiation leakage to the environment and maximize power coupling efficiency, metal chokes are designed into the cavity walls.
Computational Domain & Resonator Design
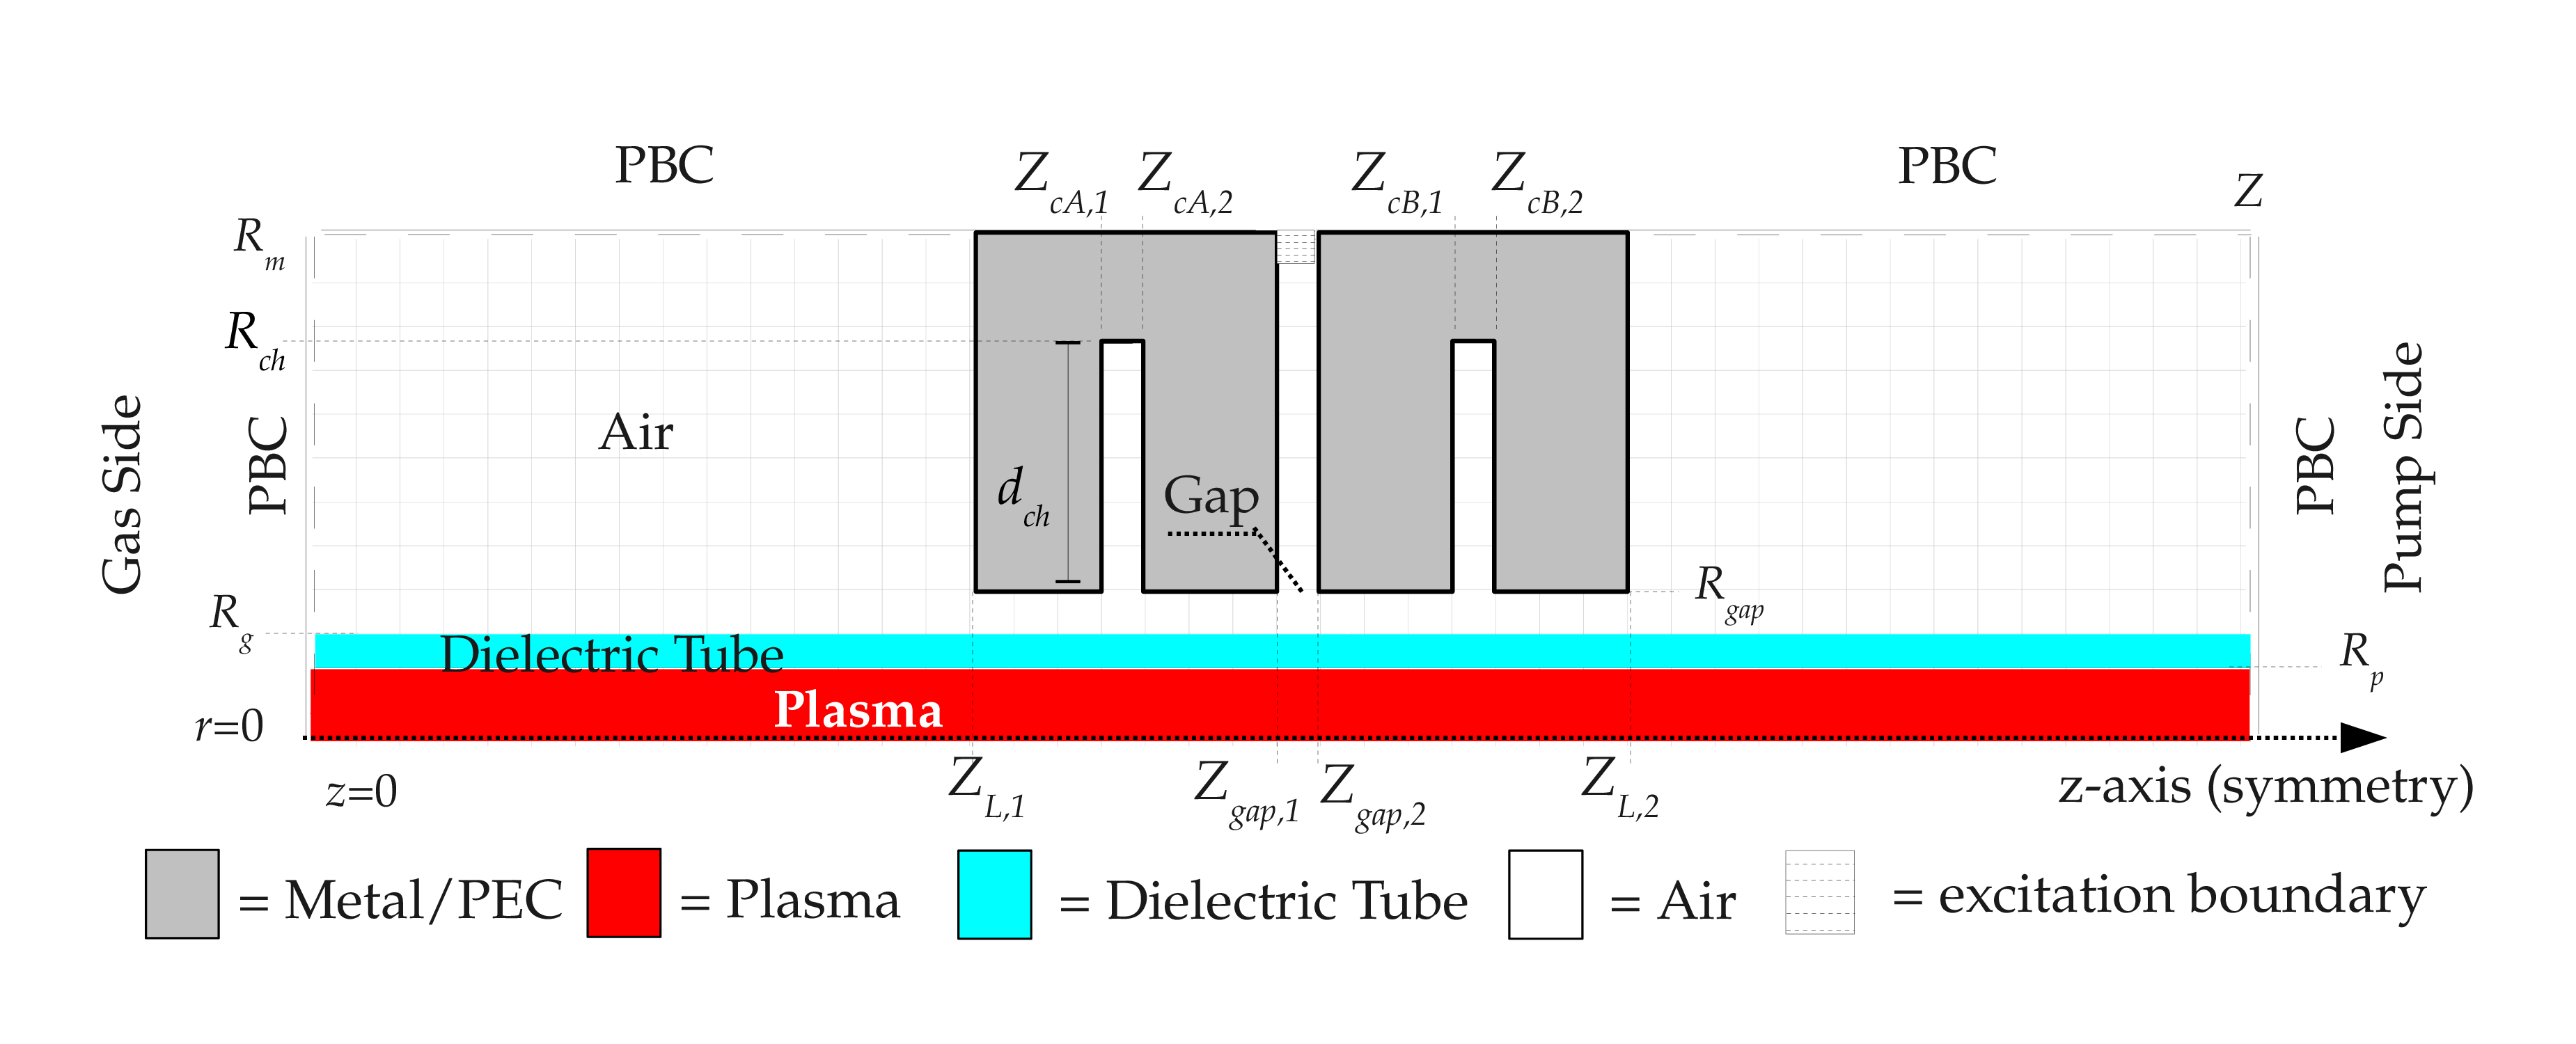
A self-consistent 2D axisymmetric multiphysics model was built using the PLASIMO simulation platform to analyze the interaction between the electromagnetics, transport processes, and argon chemistry inside the PCVD reactor.
The electromagnetic fields are solved as TM modes. Discontinuities in the cavity walls (such as quarter-wave short-circuit chokes) are modeled to maximize reflections and prevent waves from leaking out of the reactor region into the environment.
2D Spatial Plasma Distributions
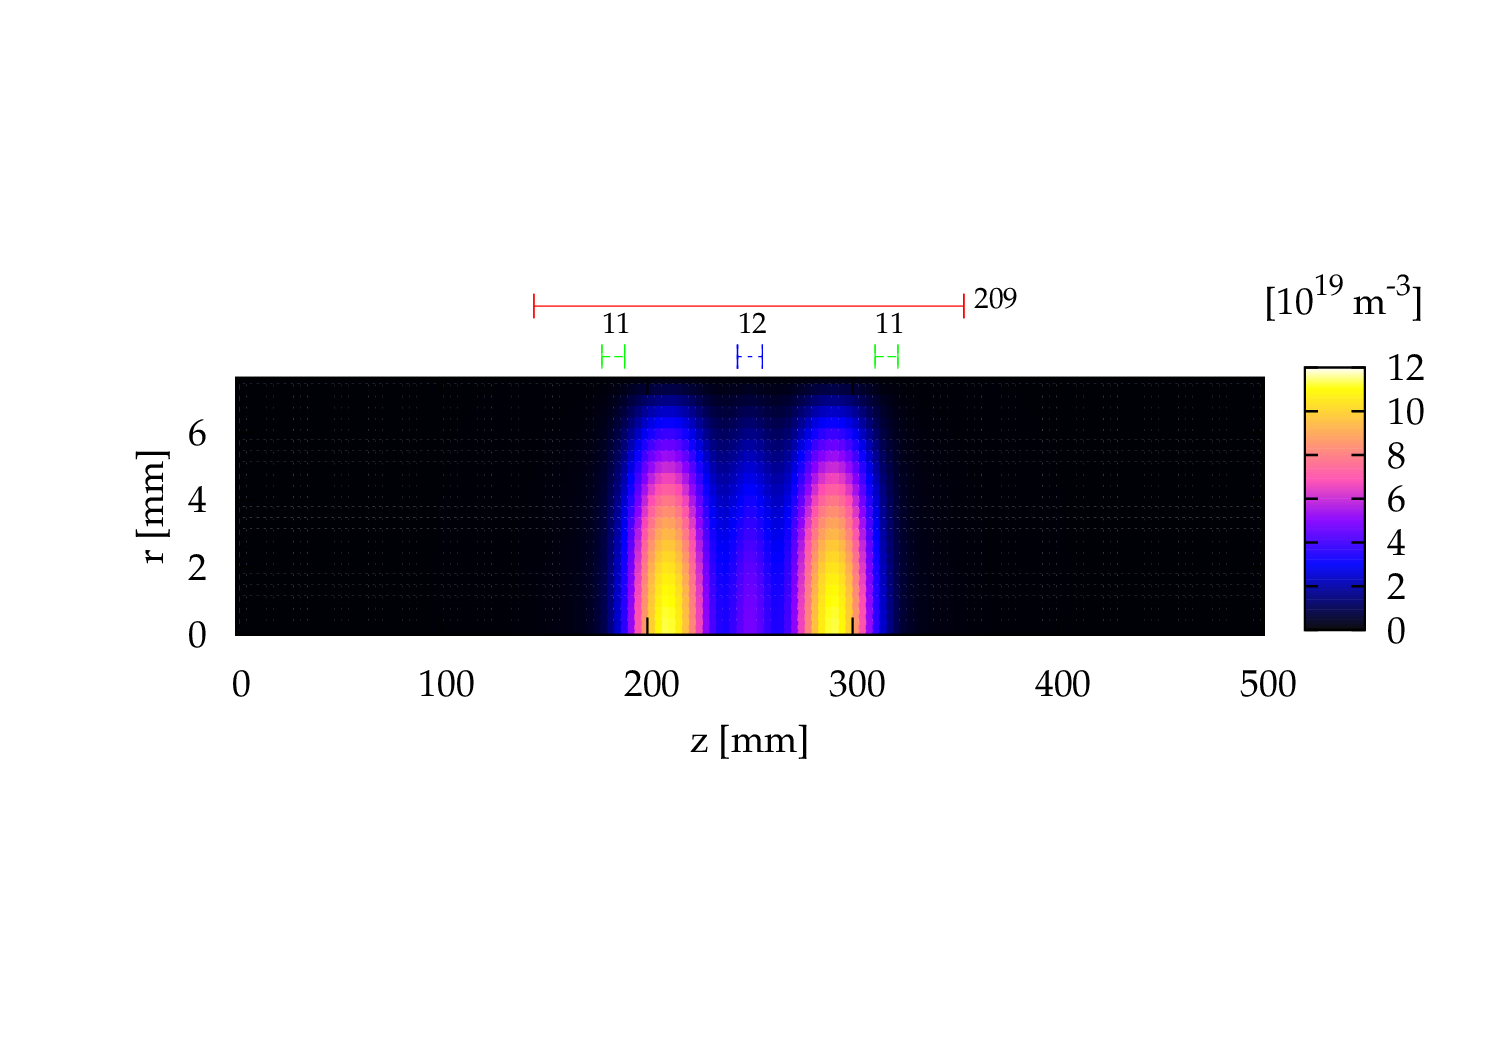
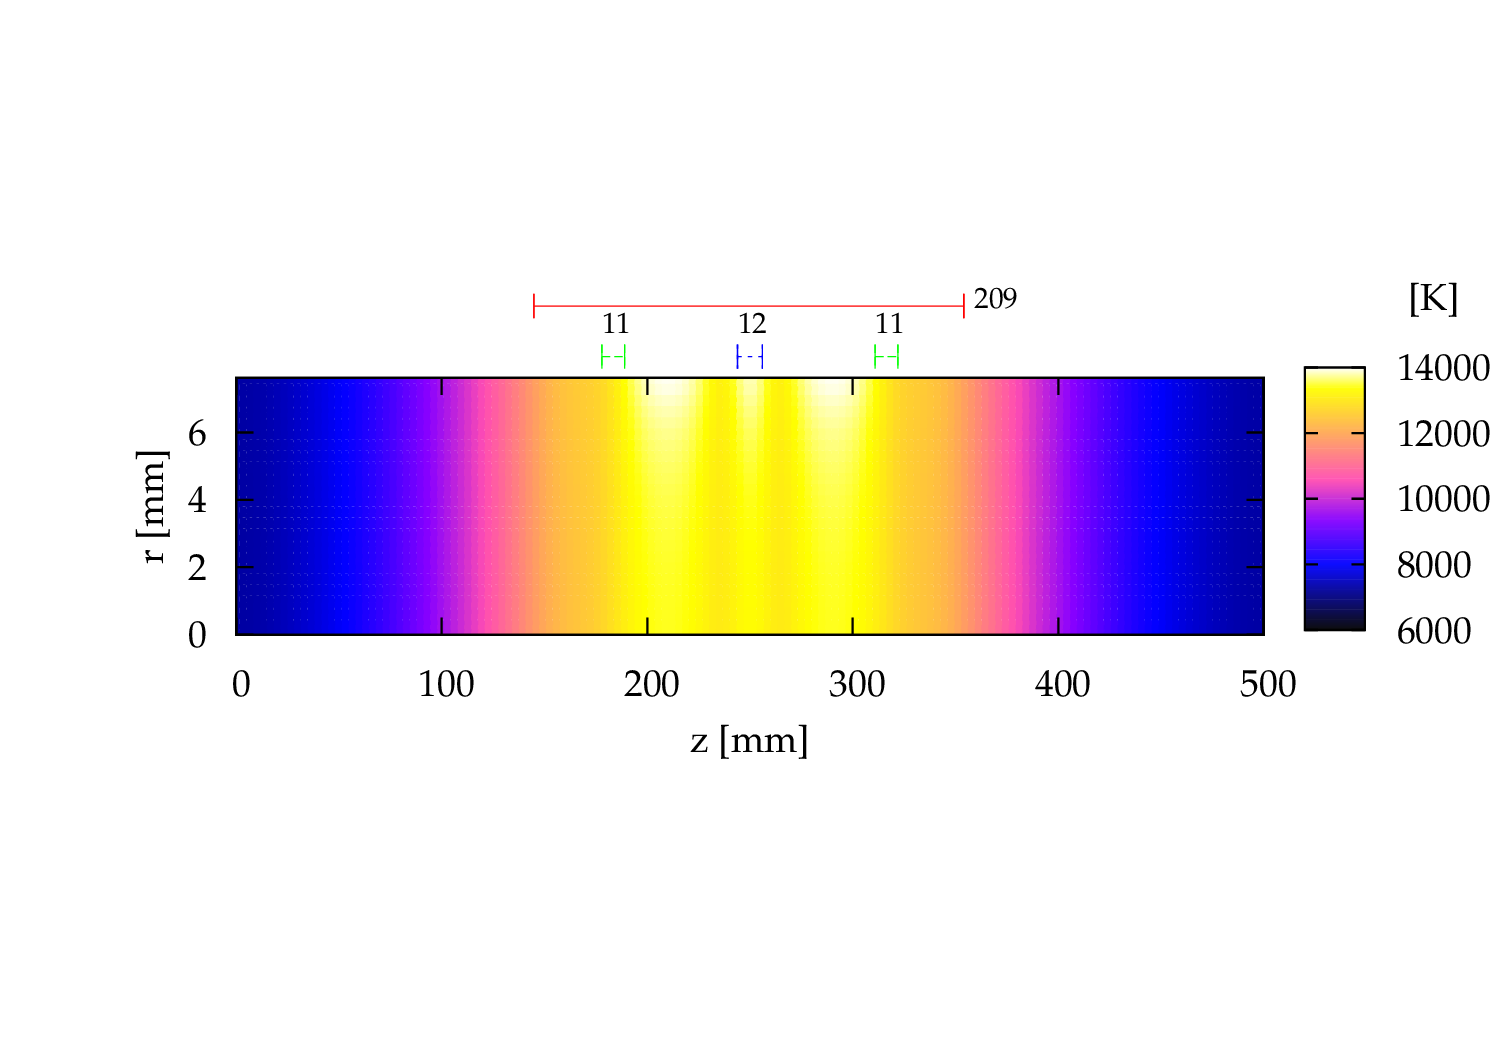
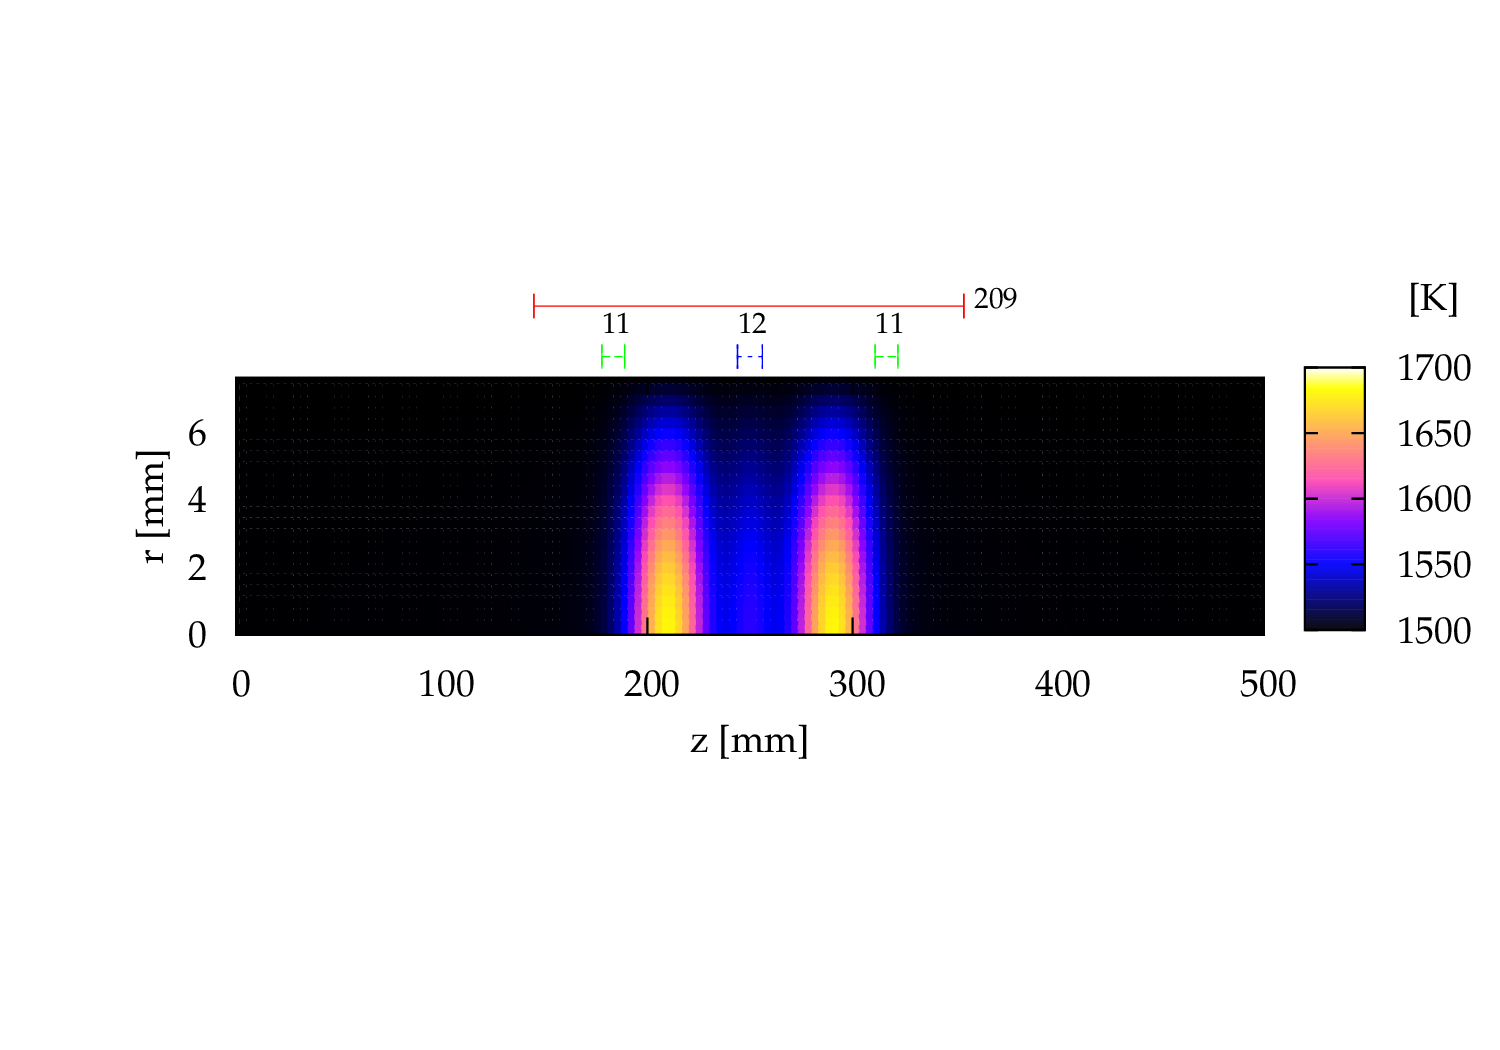
The model self-consistently computes the 2D spatial distribution of the main plasma quantities: the electron density ($n_e$), electron temperature ($T_e$), and gas temperature ($T_h$). These profiles explain how the power coupled through the waveguide gap is absorbed and transported axially.
Confinement & Choke Optimization
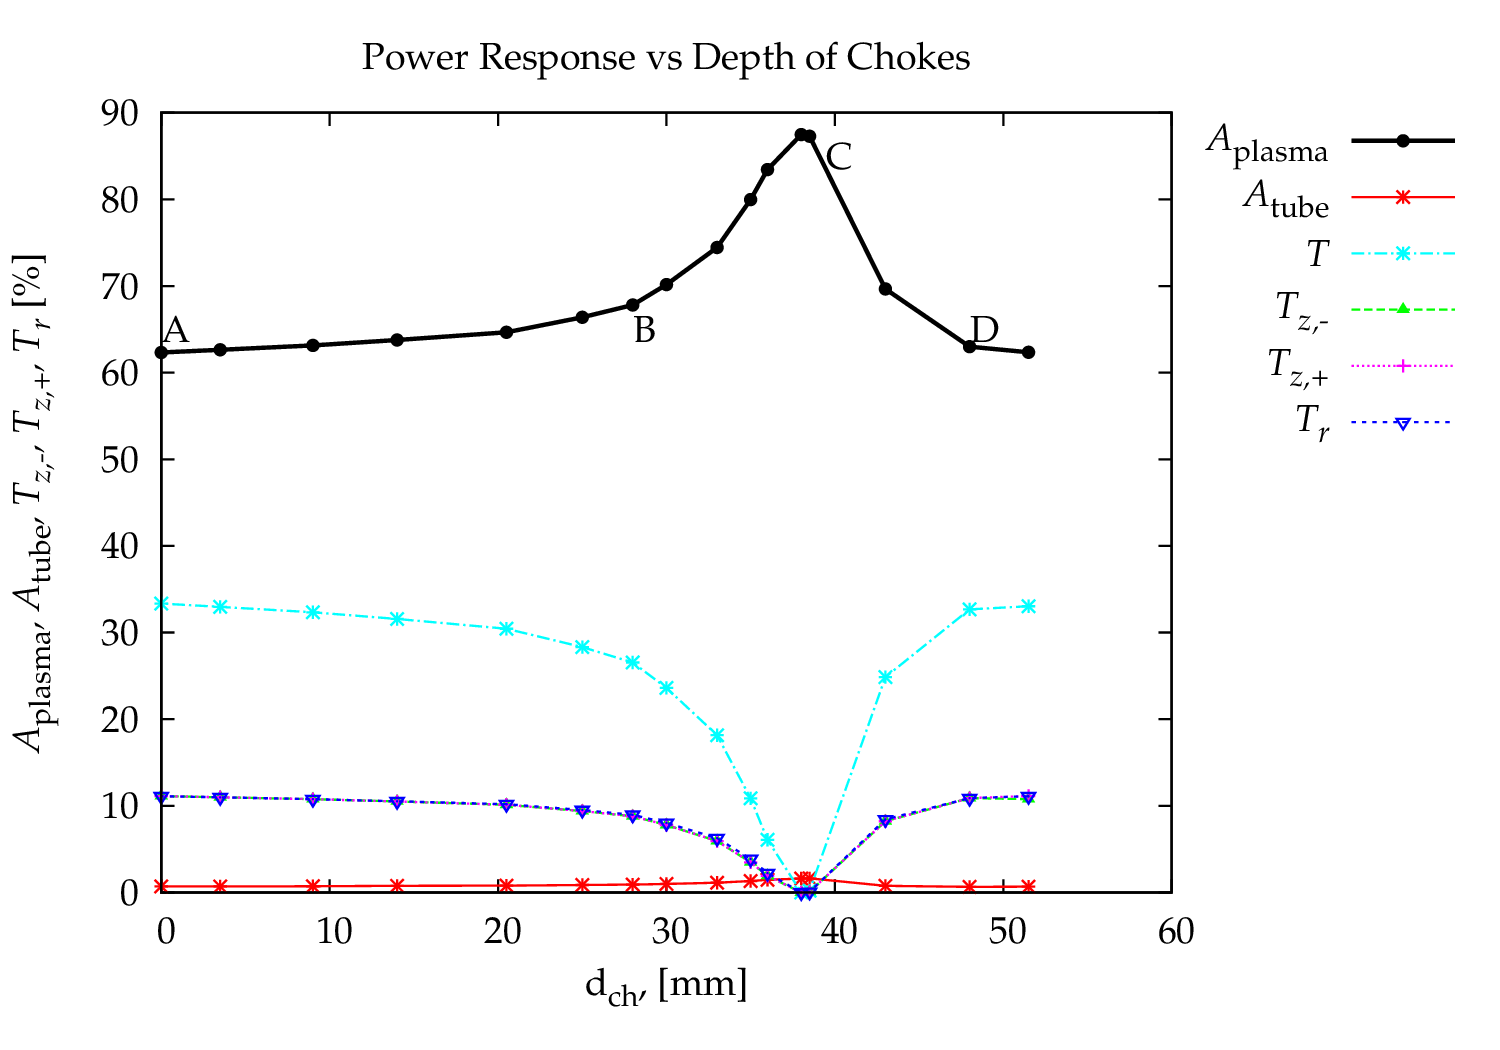
The position and depth ($d_{ch}$) of the chokes play a critical role in wave reflection. The resonance coupling of the microwave power into the plasma shifts depending on the choke depth because the plasma is a highly dispersive medium. The figure below shows the reflected/absorbed power as a function of the choke depth, highlighting the confinement optimum.
Radial Densities
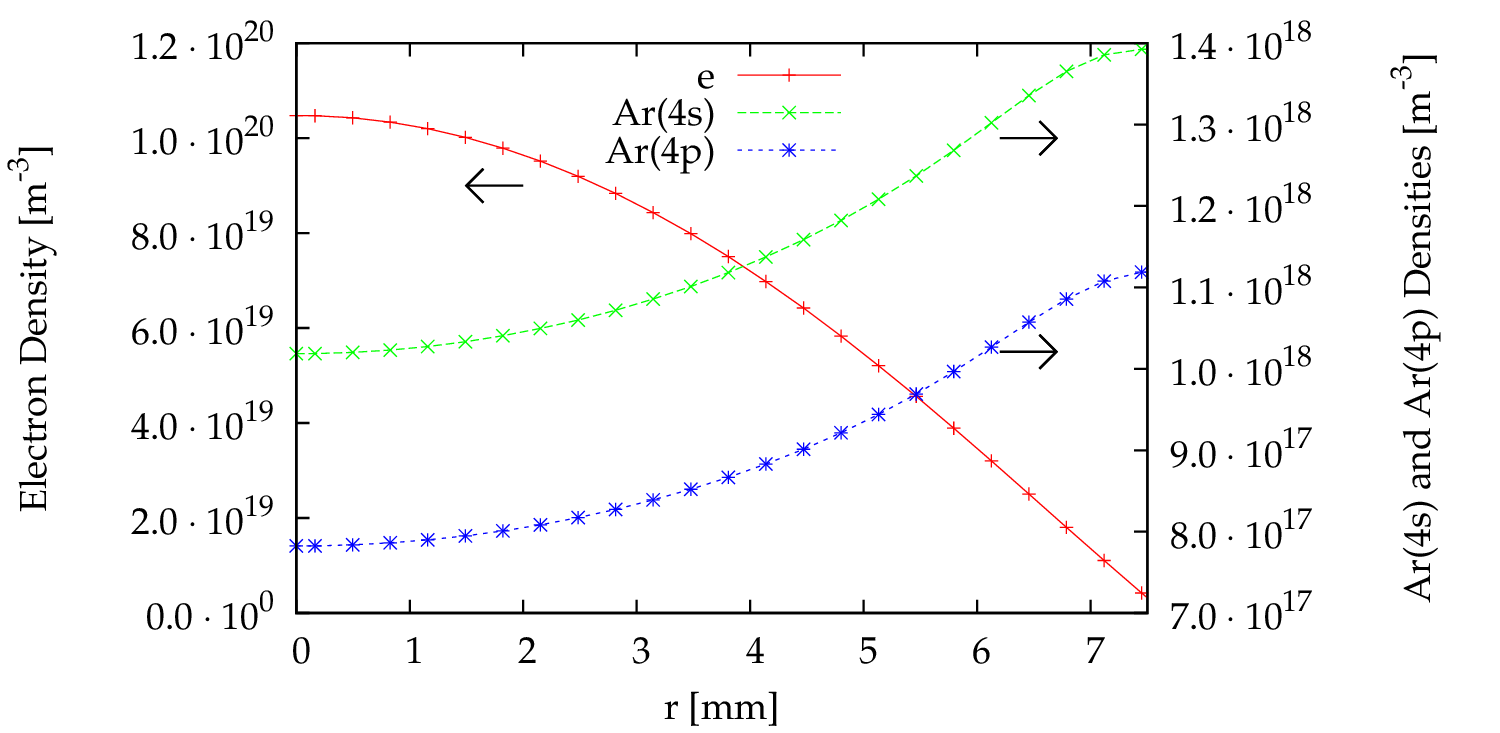
Detailed radial species distribution profiles show how charged particles (electrons, atomic and molecular argon ions) and excited states behave inside the quartz boundaries, which dictates the radial plasma conductivity and chemical reactivity.
Bibliography
- Jimenez-Diaz M. (2011). Modelling of microwave induced plasmas: the interplay between electromagnetism, plasma chemistry and transport. PhD Thesis, Eindhoven University of Technology (TU/e). [ read thesis pdf ]